


Market Malarkey 4/23-4/28
Weekly Market Updates & More

Preview for this week:
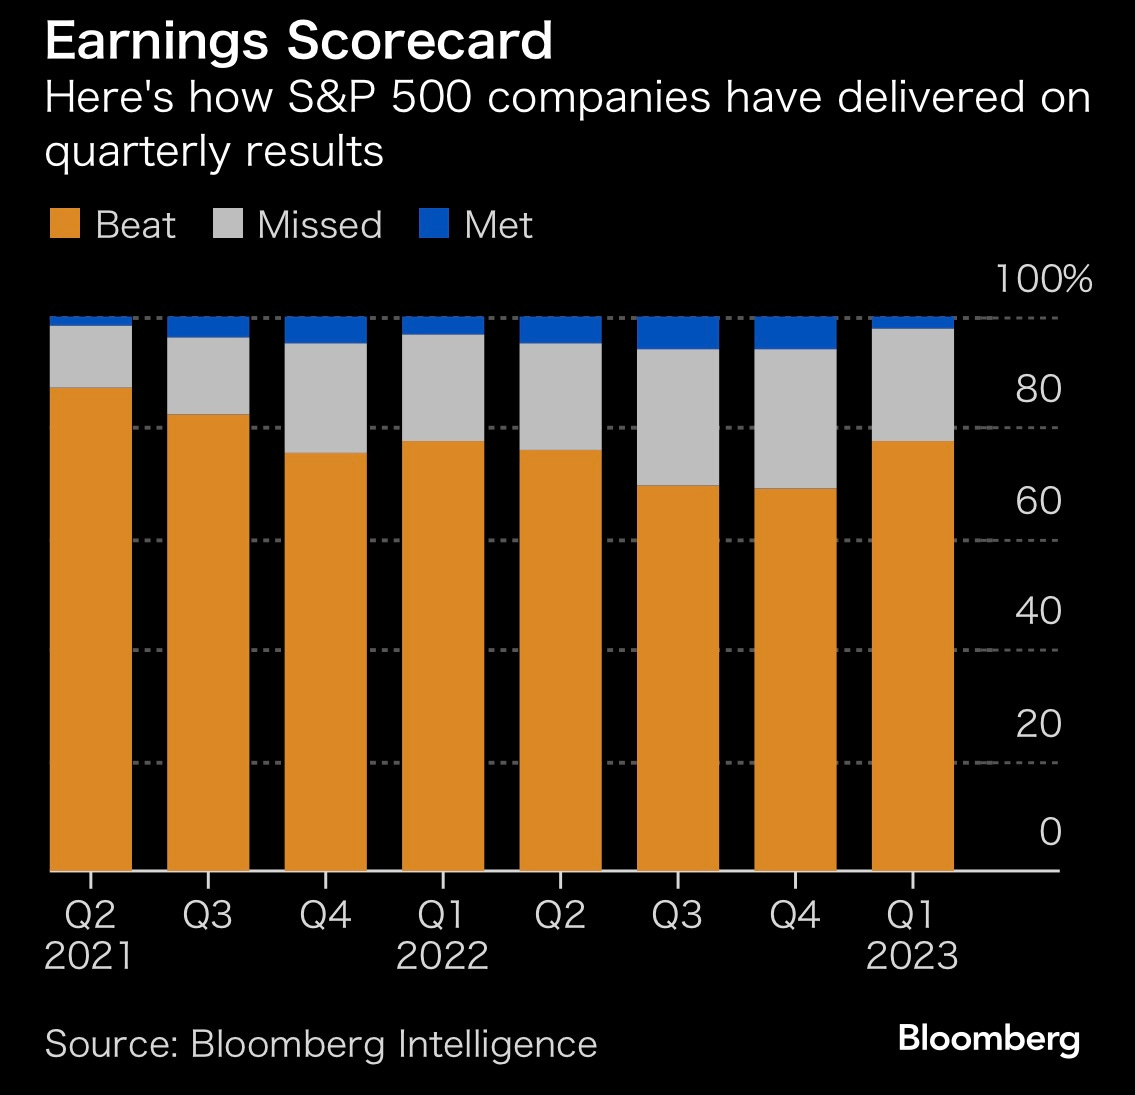
This upcoming trading week is likely to be a very interesting. Due to the fact that 42% of the S&P 500 by market capitalization will report their earnings by Friday the 28th of April. (Figure 1) We included this figure in last weeks Market Malarkey, so how have earnings been so far? According to an article by Bloomberg, around 20% of the S&P 500 have reported earnings with 77% beating estimates, which can be seen in Figure 2.
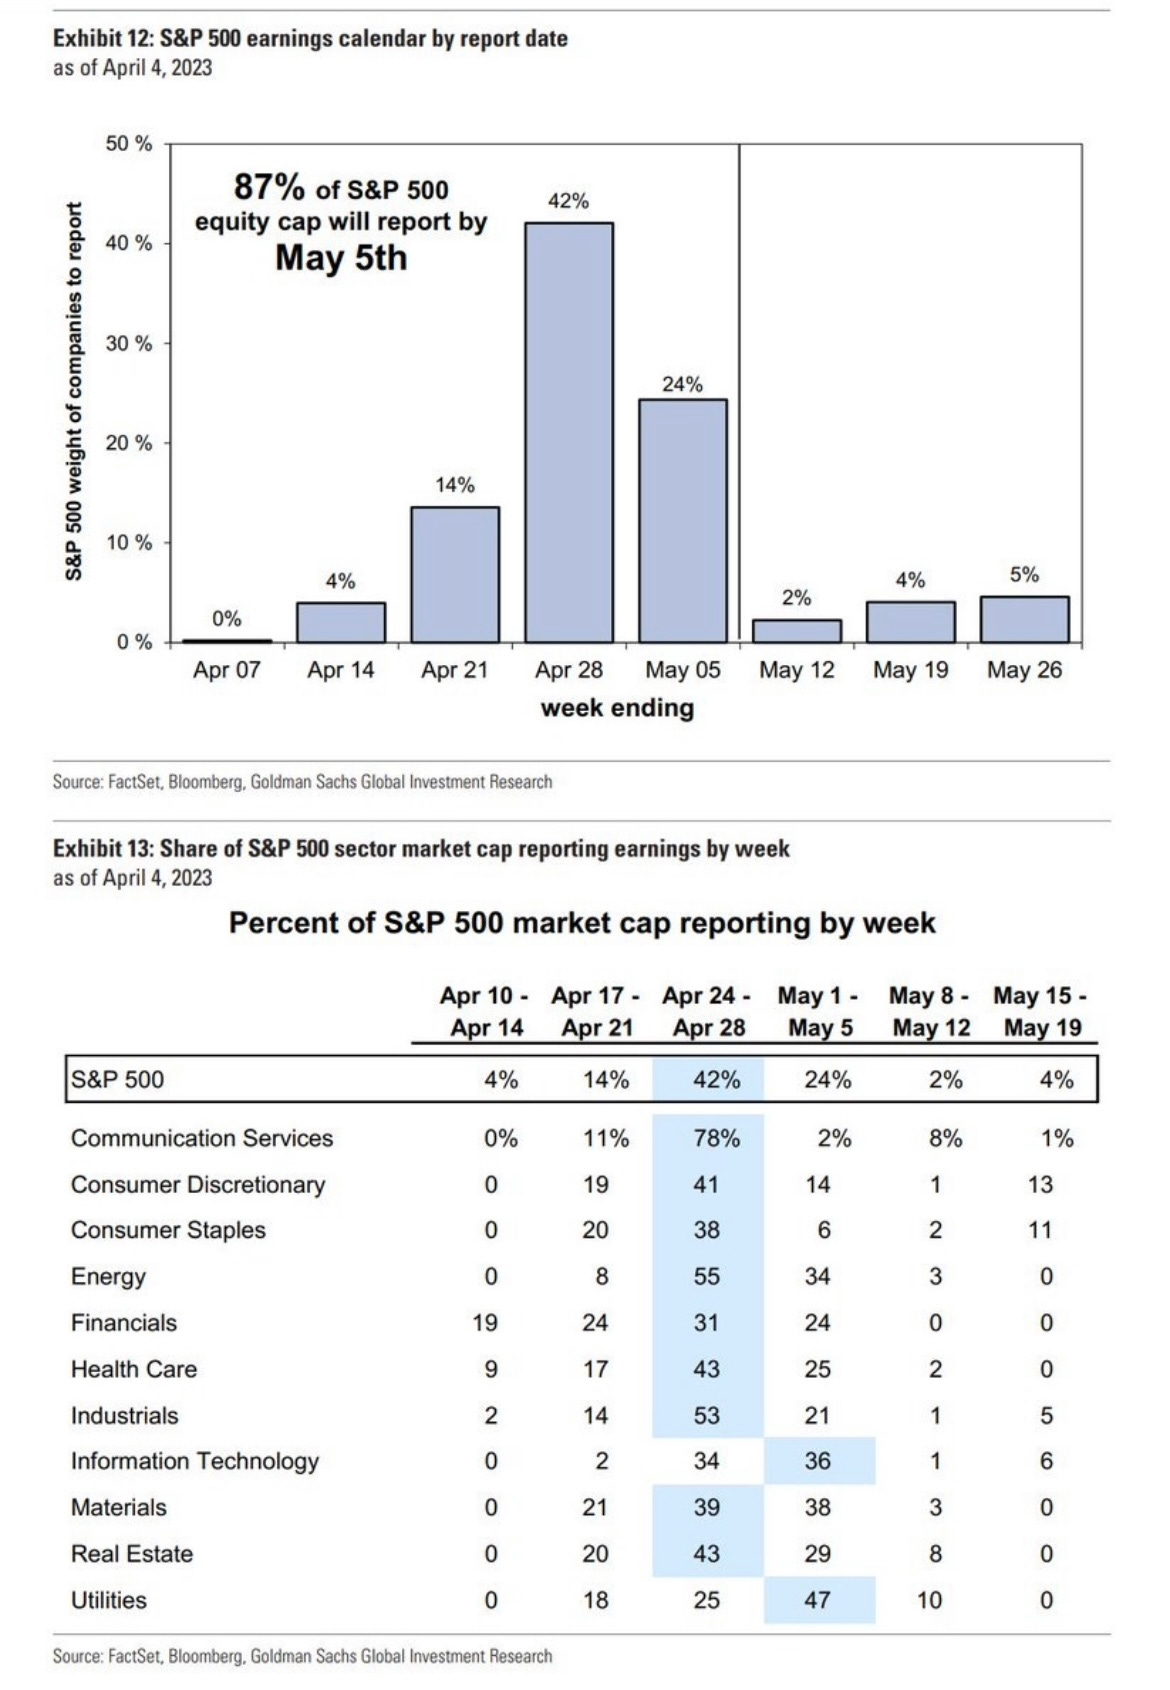
So, will this trend continue this upcoming week? In our view, it is much too early to say. This upcoming week of earnings is much more diverse when it comes to the types of companies reporting when compared to the last two weeks as shown in Figure 1.
Some notable earnings we would like to review from last week. First up is TSLA, the market did not react well to TSLA earnings release (ER). As you can see in Figure 3, TSLA gapped down after their ER with the stock losing -12.5% of its value before earnings. Also of note is the money flow index in bottom half of Figure 3.

Below you can see the dip in EPS and sales experienced by TSLA. (Figure 4) We are firmly in the bearish camp on TSLA (but that is for another article).

Next up we would like to review the price action on NFLX after their ER. As can be seen in Figure 5 NFLX had a brutal initial sell off dropping the stock to 292.00 a share. However, buyers quickly stepped in and as of Friday’s close NFLX share price returned to the 320 range. (Figure 5)

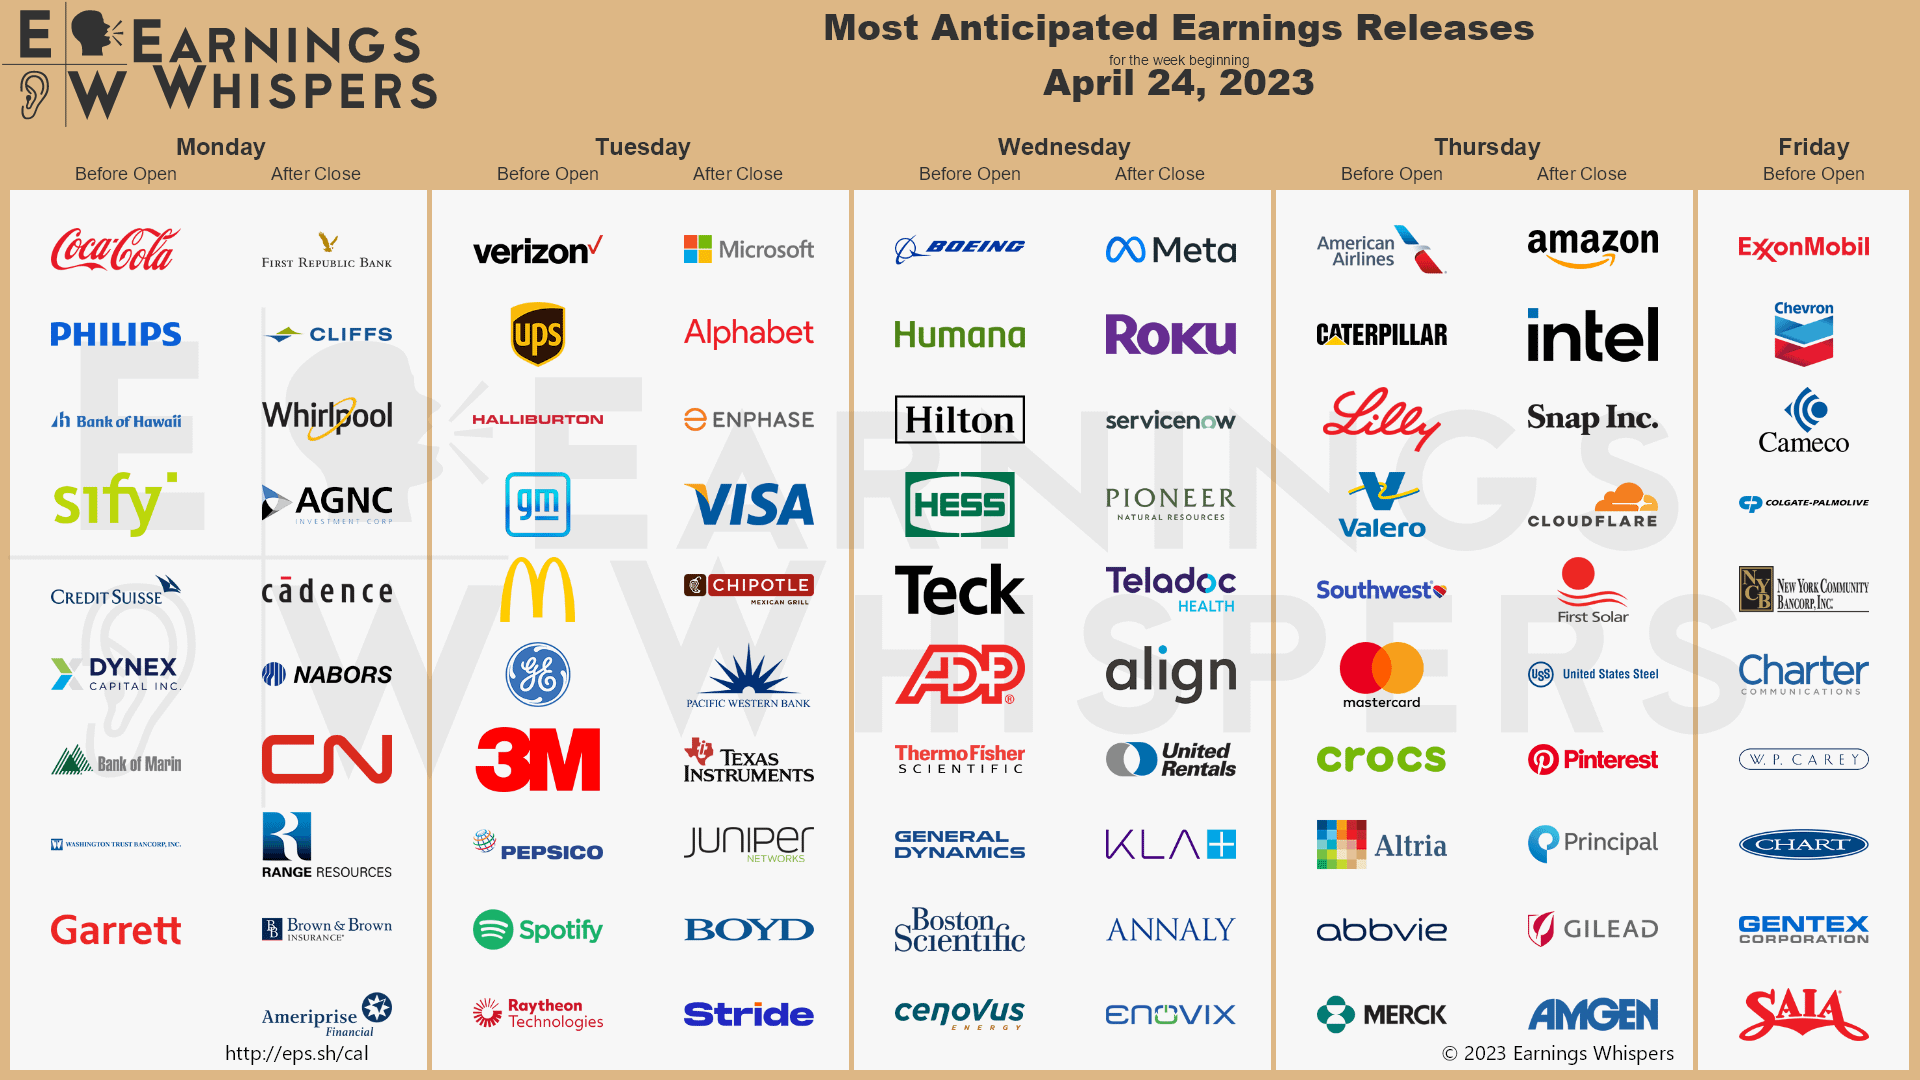
Now onto this upcoming week and it’s ERs, as you can likely see there are some major ERs this week. (Figure 6) We will be watching the following ERs: KO, FRC, MSFT, GOOG, BA, META, AAL, LLY, AMZN, & XOM. It is our view that those companies are the ones that will make the market move in one direction or the other.
US Treasuries:
The US Treasuries (USTs) yields continue to rise from the shortest maturity to the longest maturity. For our TA analysis of UST yields we will be starting with the 2Y UST yield. The 2Y yield appears to have broken out of the range it was trading in after the SVB crisis. (Figure 7) On April 19th the 2Y yield rejected at 4.205% as shown in Figure 7, we believe that the 2Y will re-test the 4.205% this week. If this level is broken and held then it is our view the 2Y yield could retest the 4.5% zone. (Figure 7) If the 2Y rejects around the 4.205% area, it is likely the 2Y will re-test the support level around 4.0% which is also where the 200d SMA (dark red line) is at. (Figure 7)

As for the 10Y UST yield it also failed to break an important trendline (white line) which can be seen in Figure 8. It is our view that the 10Y yield will likely fail to break and hold above the resistance area around 3.625% this week. (Figure 8) If this rejection happens we believe the 10Y yield will go back to being range bound, this is illustrated in the Figure below by the yellow line and trend channel.

After a clean break and hold above the 200d WMA (white line) the 30Y UST yield is looking rather strong in our view. (Figure 9) We see the next key resistance level for the 30Y at 3.85%. (Figure 9)

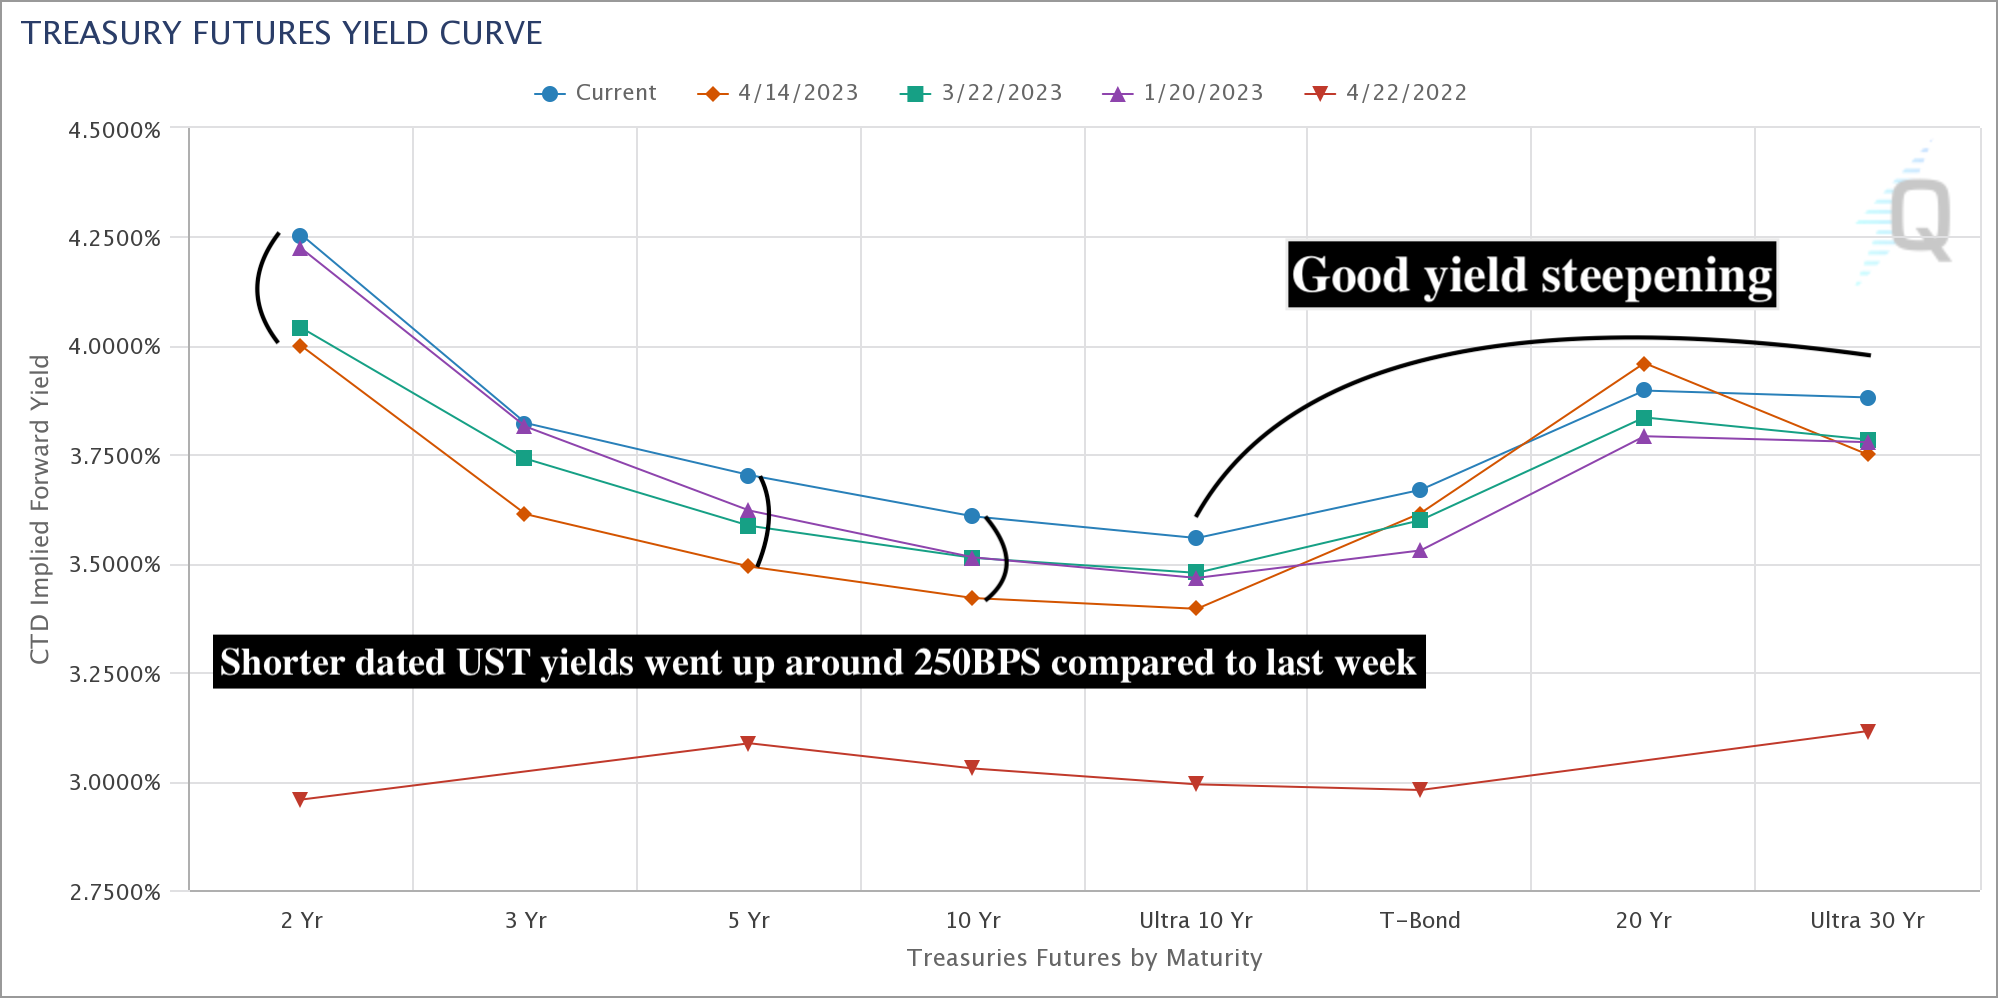
Yield curve analysis, the front end of the yield curve shot up in comparison to last week. (Figure 10) With the 2Y, 5Y & 10Y all gaining around 250 BPS up from there yields last week. (Figure 10) On the bright side of the yield curve the longest dated bonds steepening the back end of the curve as we illustrated in Figure 10.
Possible trades:
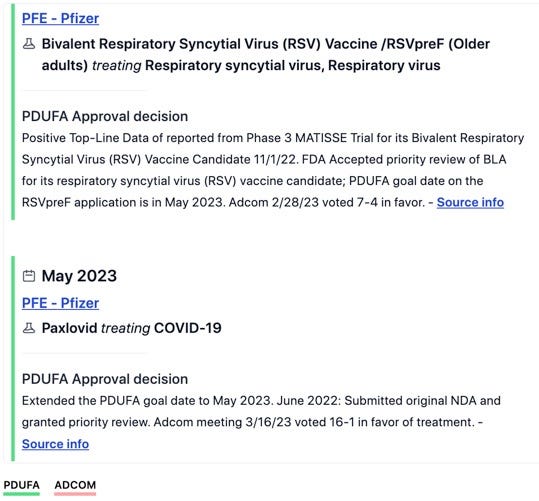
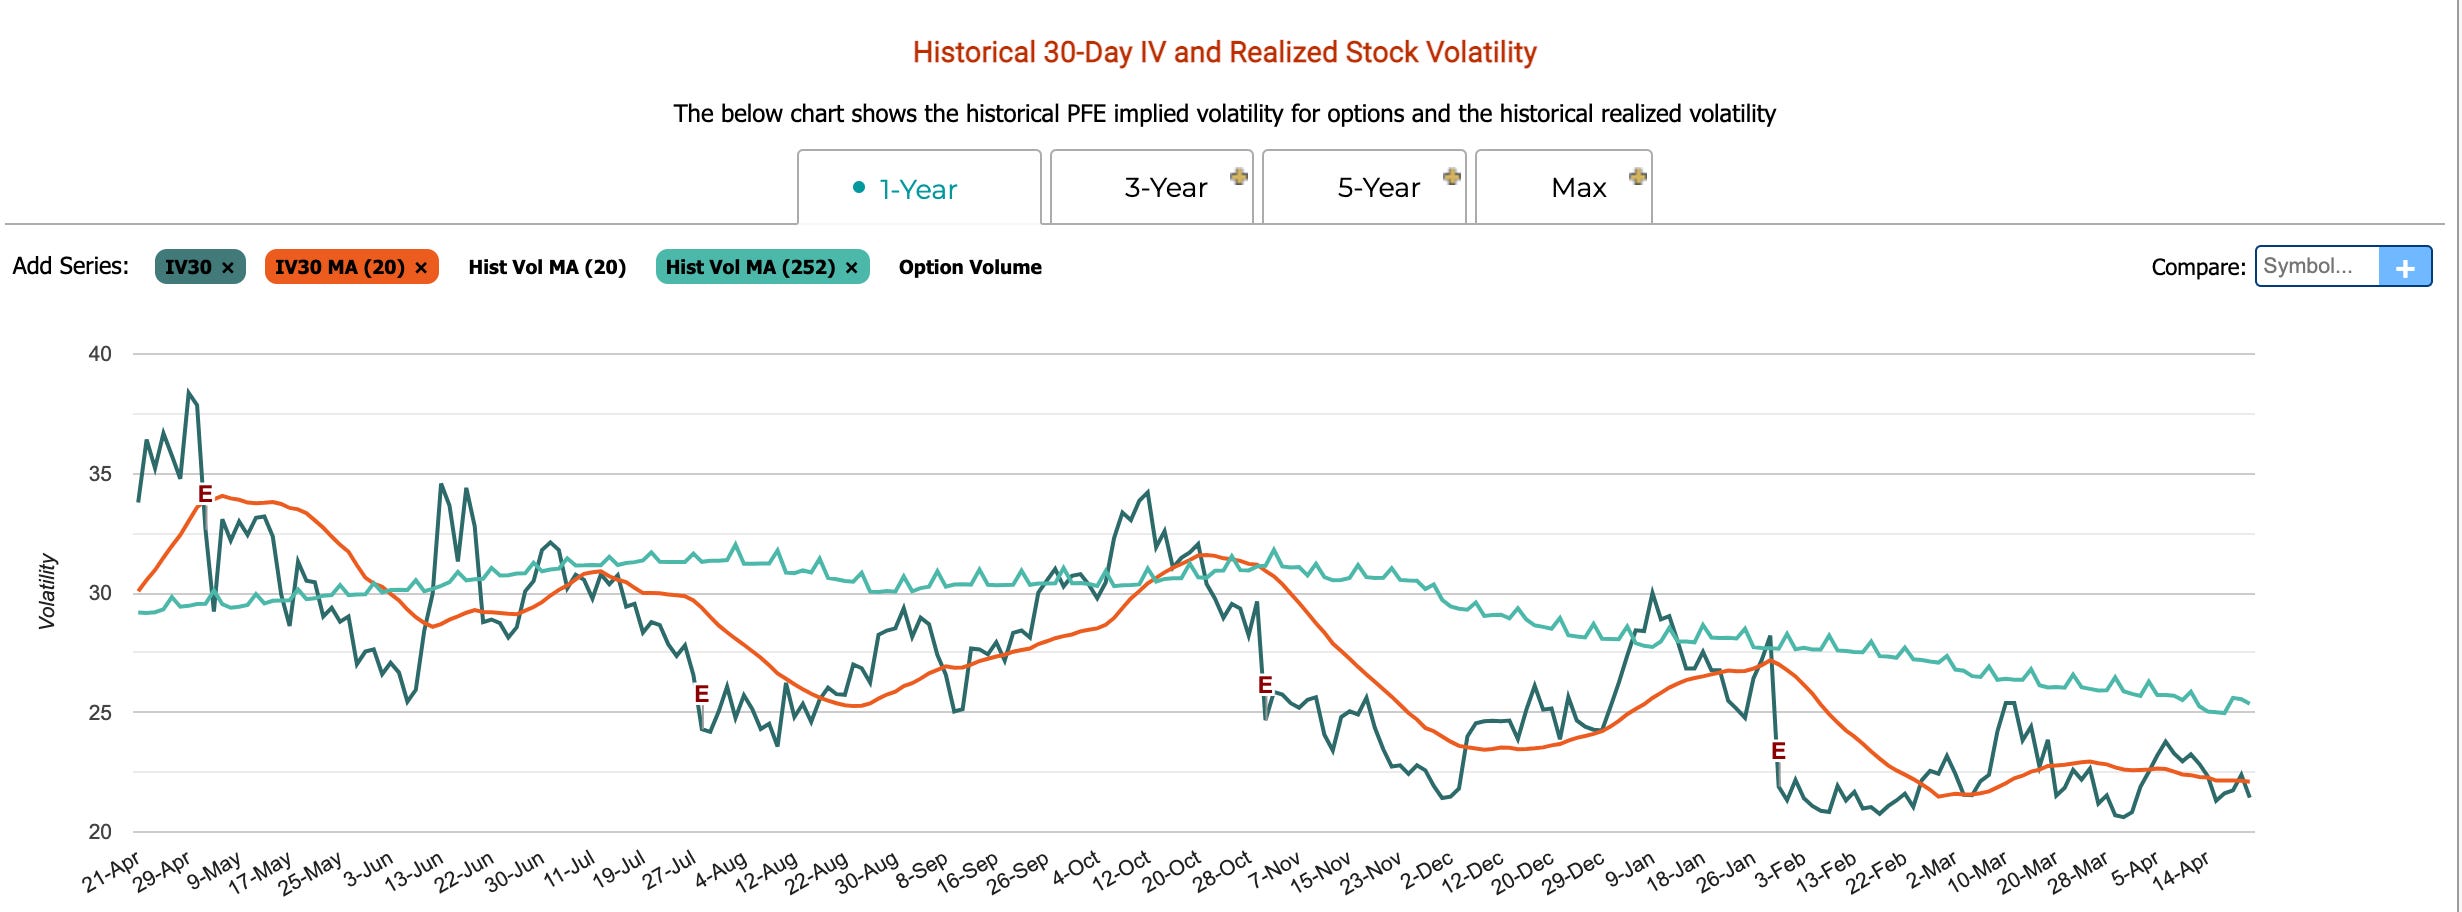
Long PFE: We believe that PFE is currently undervalued, we came to this conclusion based on the following factors. First, PFE has three catalyst in the next month or so on April 30th PFE has a medical data readout. Followed by two PDUFA approval decisions the details of which can be seen below in Figure 11. We are bullish on both of these PDUFA approvals, along with this PFE option implied volatility (IV) is extremely low. (Figure 12) Not only does PFE have the three aforementioned catalysts but the company will release its ER on May 2nd. One possible way to put on this trade is by buying long calls and capture the IV gain. Finally, from a TA perspective in our view PFE looks like it can rise to 42 and possibly even higher. (Figure 13)

Short TLT: As we mentioned in our UST section it is our view that the 30Y yield will keep rising. This drops the price of TLT as it tracks 20Y+ duration USTs. Also of note is the three notable price gaps TLT has on a daily chart, which is shown in Figure 14. The gap up (green area) is likely to get filled first as it is rather small and we see the 200d WMA (white line) as a semi strong support. The most practical way to put on this trade is by buying long puts. If a trader puts on this position it is highly recommended they watch the 20Y & 30Y UST yields.

Charts:
Last but not least we have a new section added to Market Malarkey. As the name suggests this section will include some charts we found interesting along with our commentary.

In Figure 15 you can see the relationship between the credit spread index and the S&P 500. We also highly recommend creditspreadalert.com it is a great tool for monitoring credit spreads.
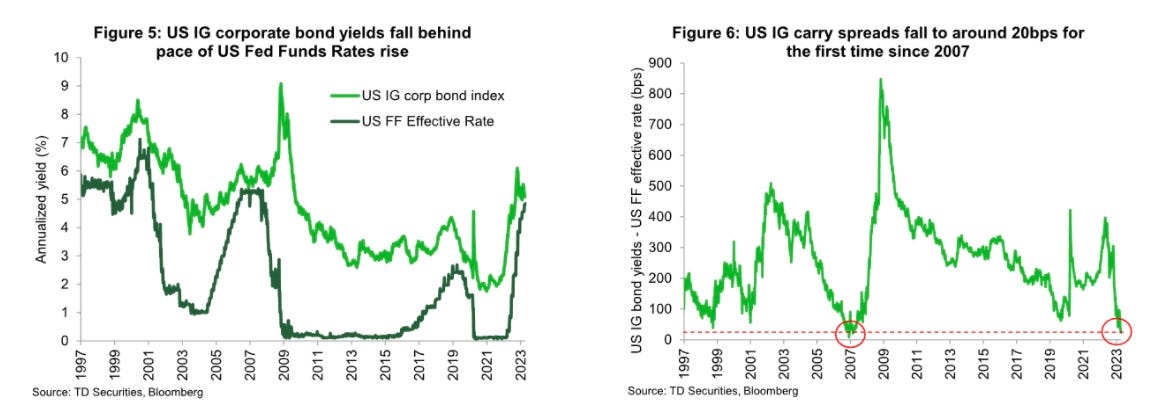
Keeping with the theme of credit spreads, in Figure 16 IG corporate bond spreads dropped to a level not seen since 2007.
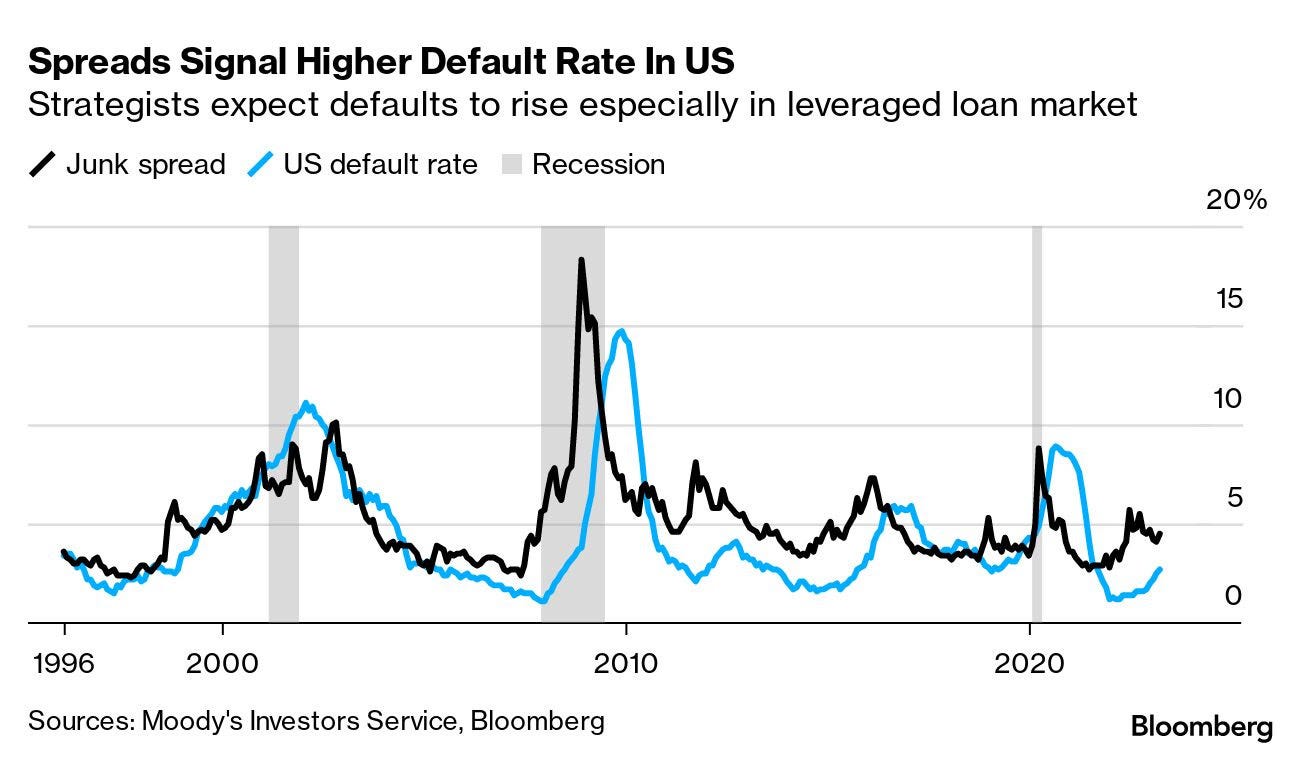
The junk or high yield spread has been disconnected from the US default rate. However according to Bloomberg they are expecting a rise in defaults especially from firms with high yield ratings. (Figure 17)
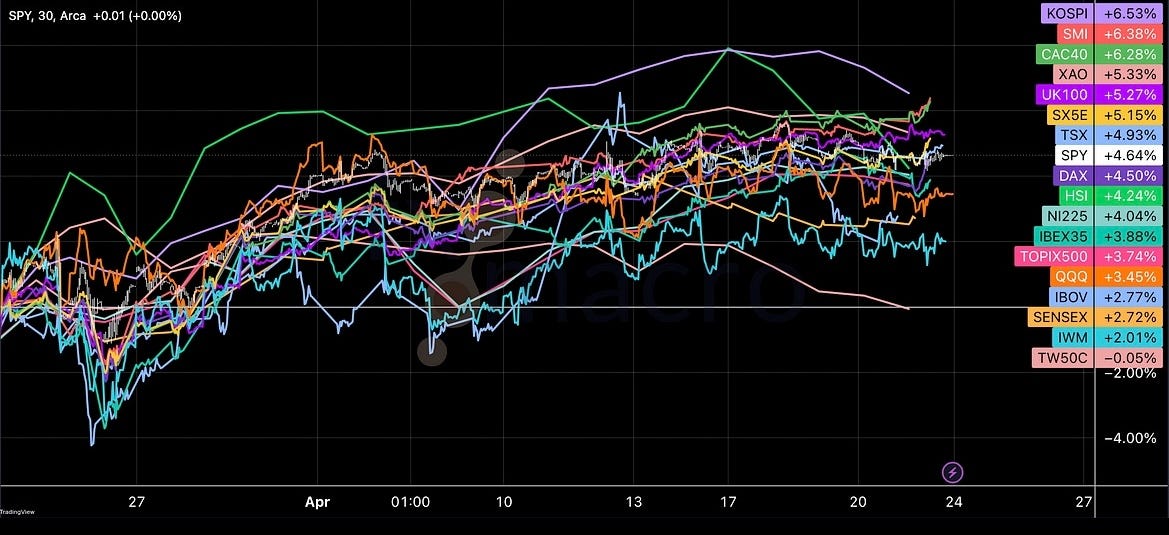
The last chart is via
I highly recommend you check out his work and subscribe to him! Figure 18 shows the global equity indexes compared, with some notable leaders including Korea, France & the UK. With the US equity indexes somewhat falling behind especially QQQ & IWM.Thank you for reading and supporting Celeritas Capital! As always we are open to any feedback positive or negative, via the comments or on Twitter.
DISCLAIMER: We are not Financial Advisors, and all information presented is for educational purposes ONLY. Financial markets can be extremely volatile, as such using good risk management is a must.
Thank you for the shout-out!