


Market Malarkey 2/27-3/3
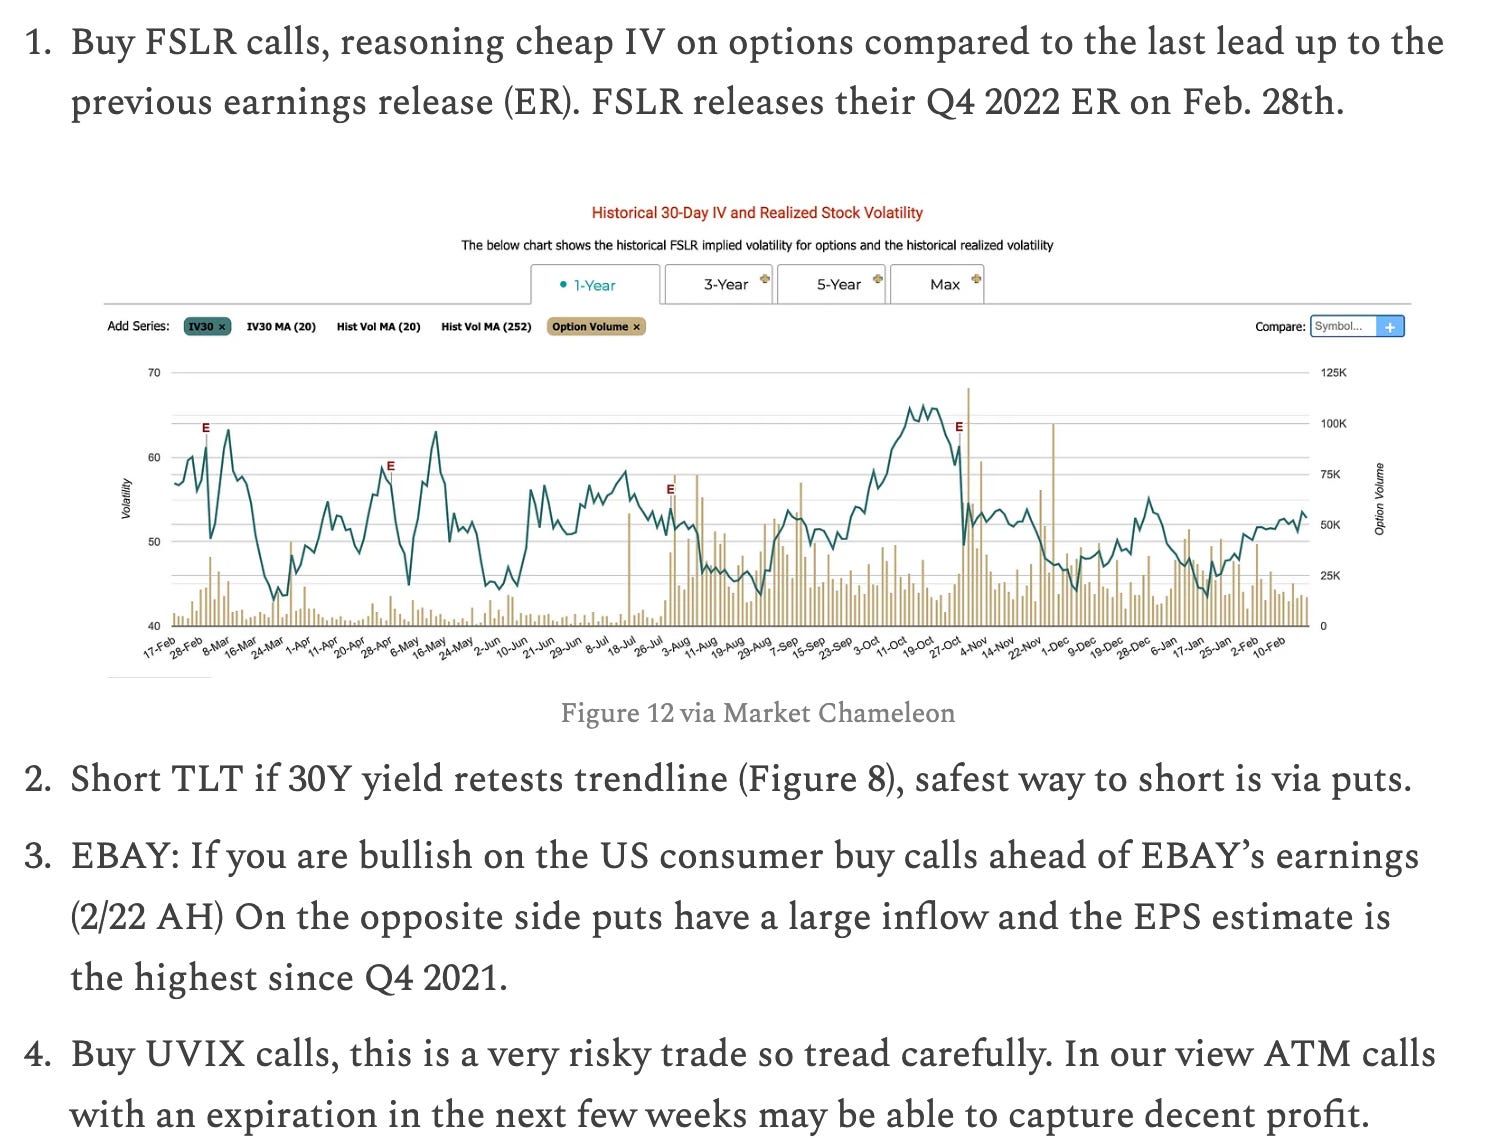
Weekly Market Updates

Rundown from last week (2/20-2/26):
This past trading week was rather volatile for the US equities markets. All of the major indexes ended the week in the red, with the NASDAQ losing the largest percentage (-3.25%). As for the US treasuries the 5Y and 10Y continued to rally with the 30Y pulling back slightly (as we predicted in last week’s Market Malarkey below are some excerpts)
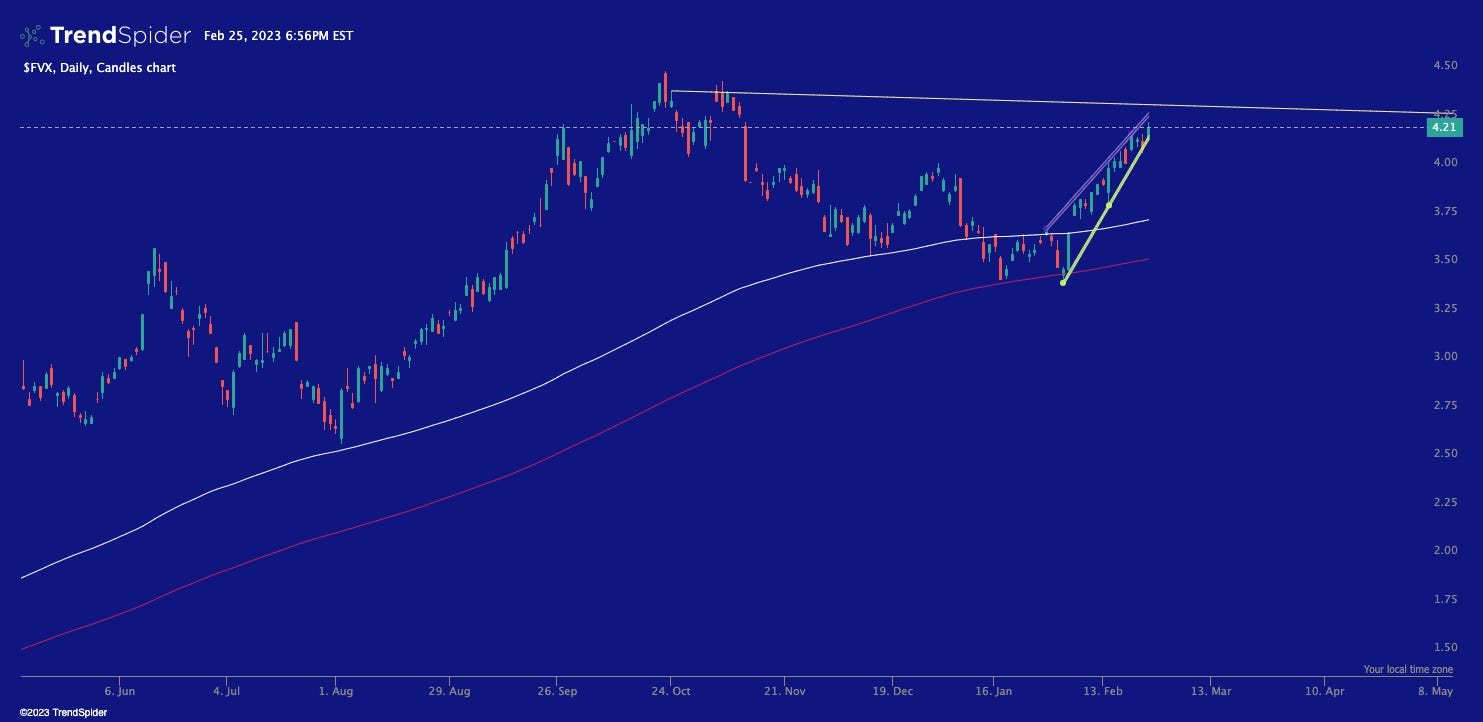
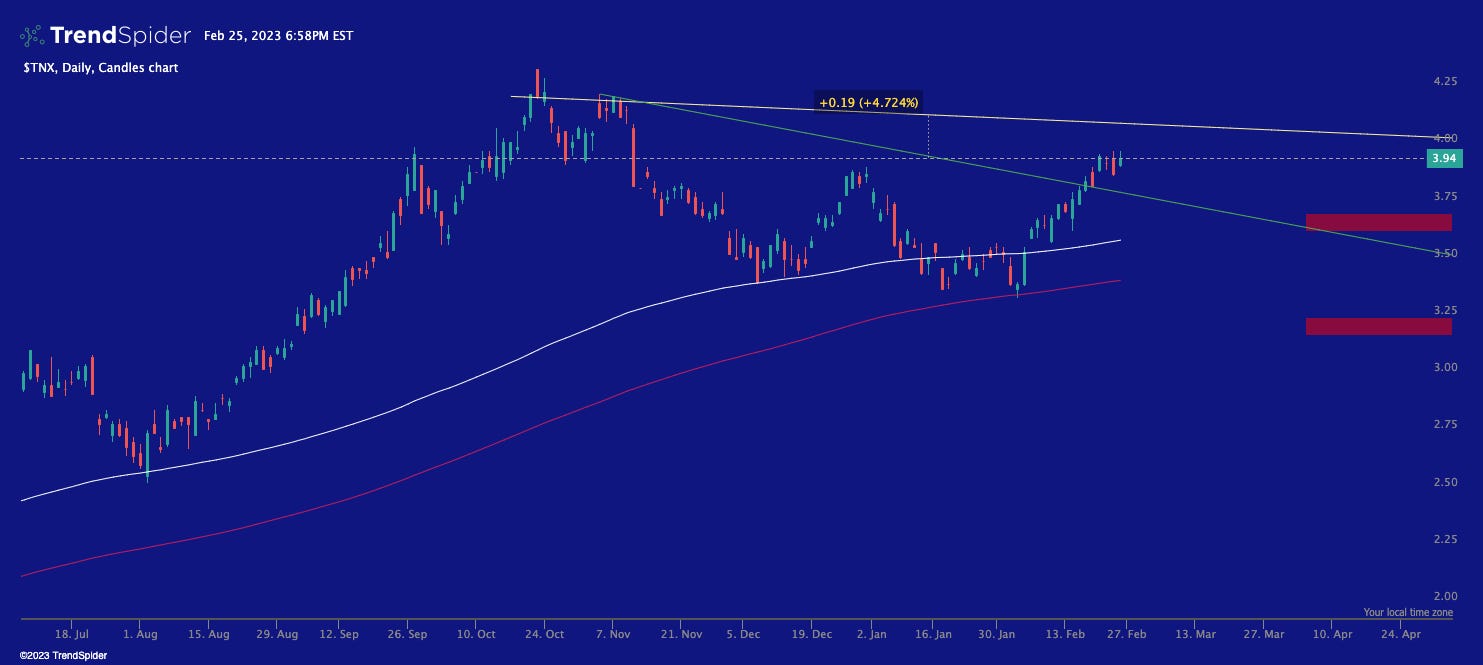
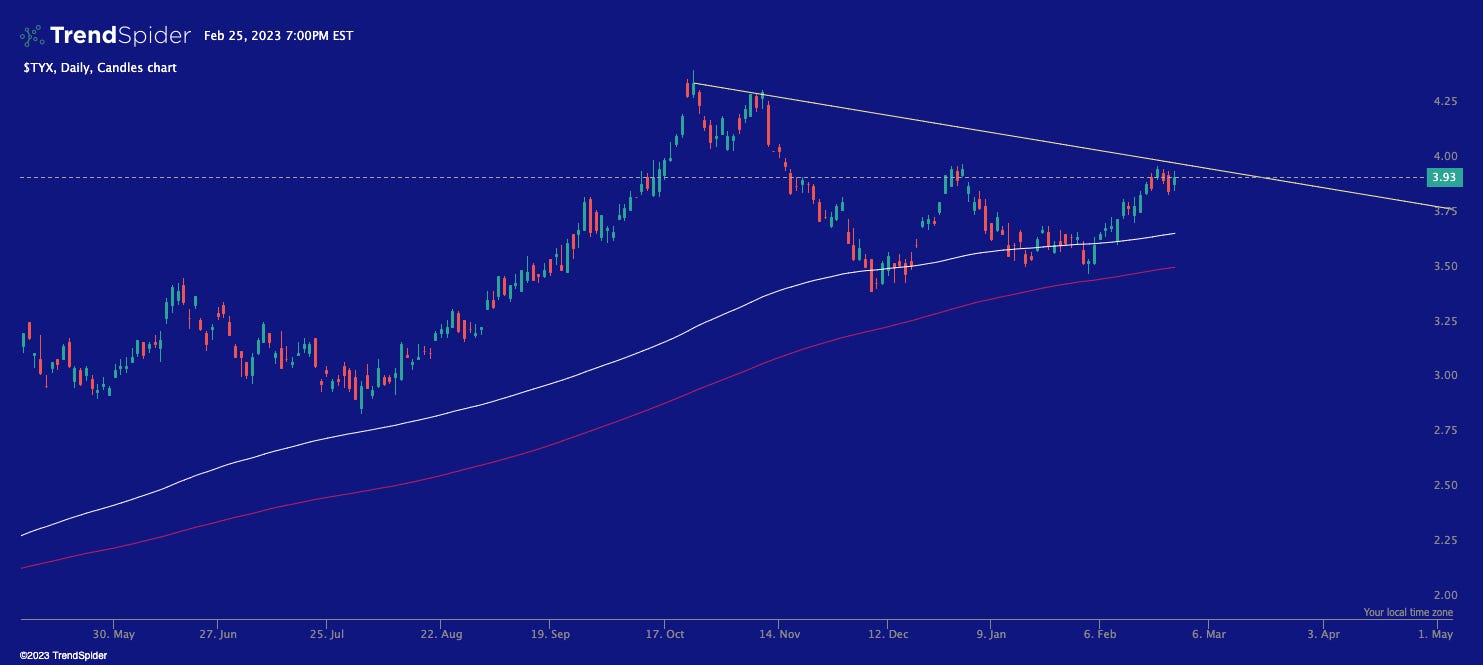
With the 5Y and 10Y still holding above their trendlines as shown in Figure 6 & 7. We expect that the old resistance trendline on FVX to act as new support area. However if the equity market falls or trades choppy this week we expect TNX to also have it’s old resistance trendline turn into a support as yields keep rising. The 30Y (TYX) broke it’s trendline but then was rejected again. This week based on our TA we expect a small pullback on TYX.
Quotes from Celeritas Capital fixed income section in Market Malarkey 2/20-2/26

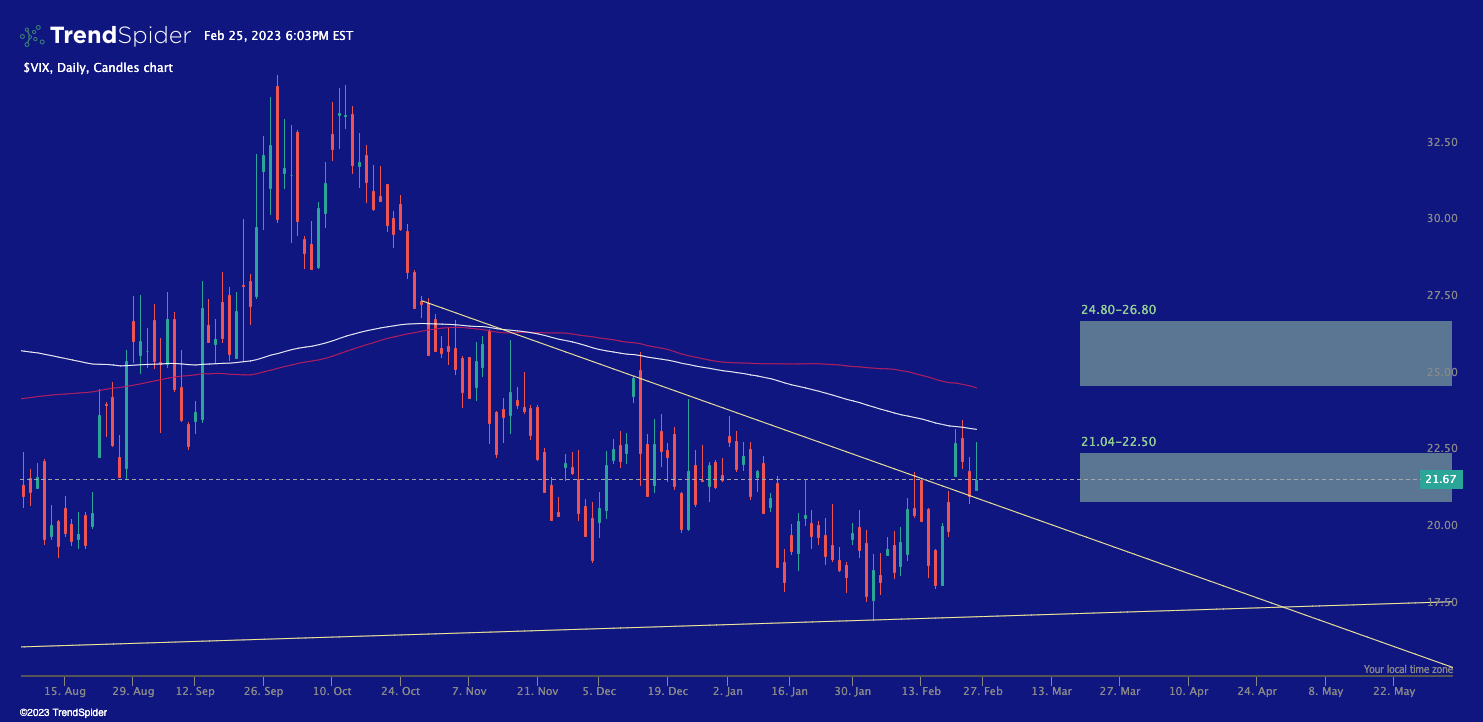
The VIX also came back to life with a weekly high of 23.63 and is working on filling a gap up to 22.50 on the daily. (Figure 2) It is our view that the US equity market is correcting from the early year bear market rally.
Preview for this week:
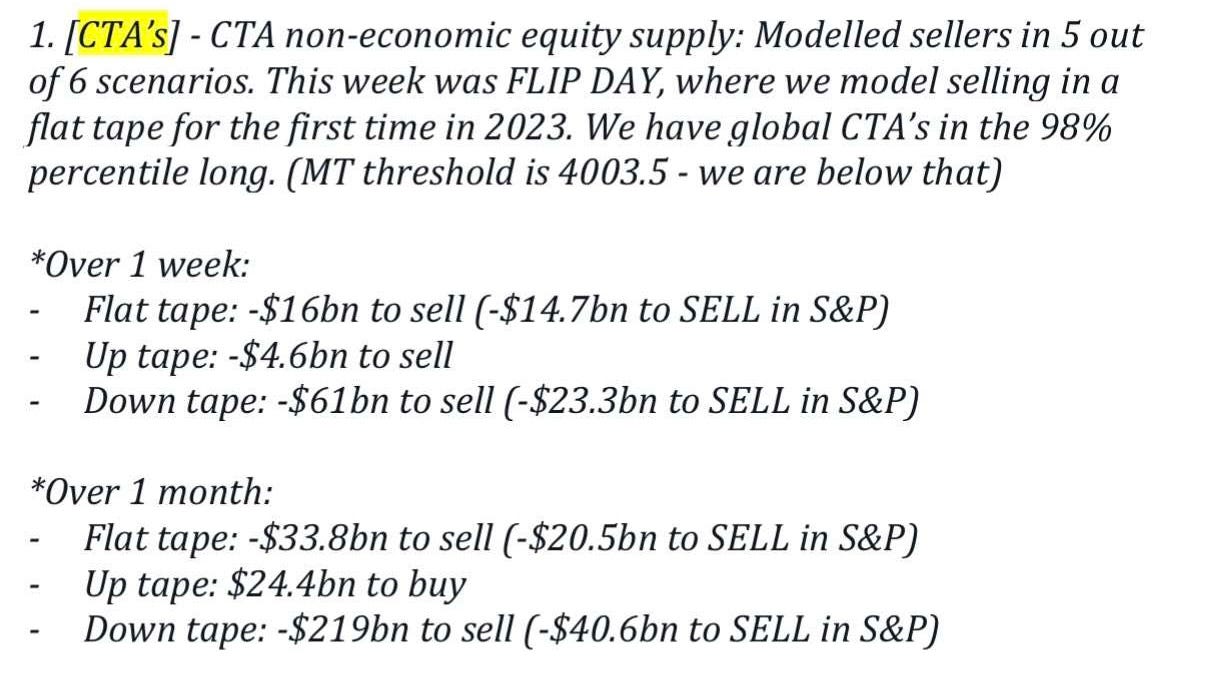
We expect this week to be another choppy week that ends with the US equity market red and the bond market green. This view is based on technical analysis but more importantly, CTAs are positioned to sell $14.7billion-$23.3billion S&P. (For those of you not familiar with what exactly a CTA is we would recommend you read Hermes BPK Partners white paper on the subject)
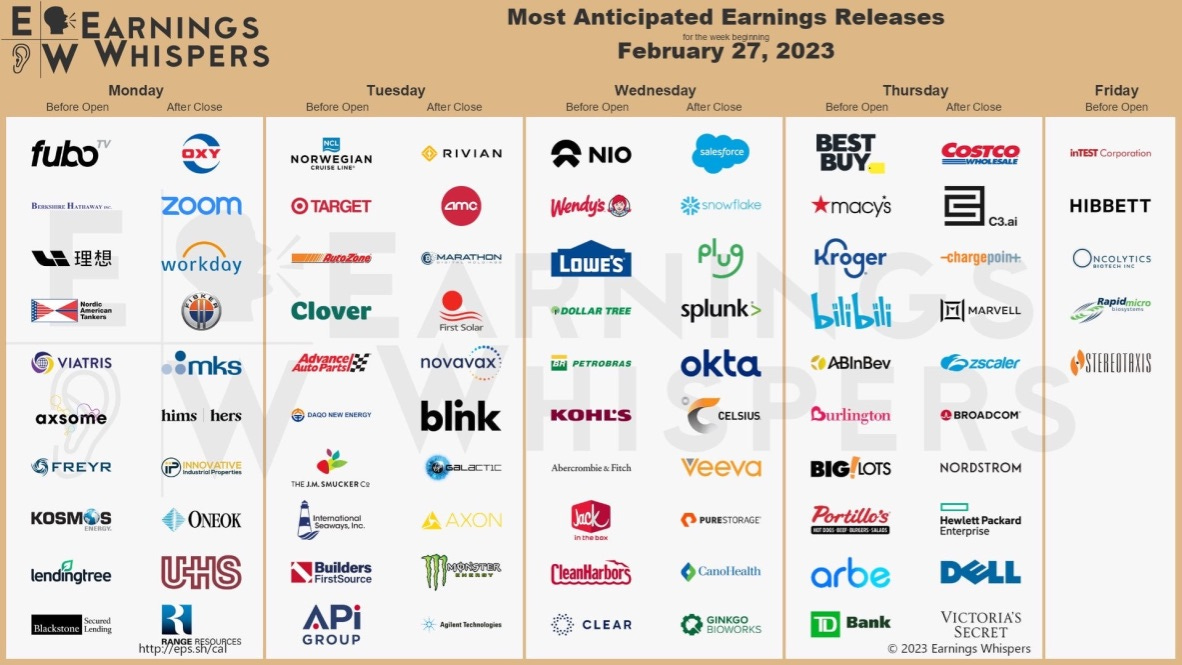
Another week, more earnings.
US Treasuries:
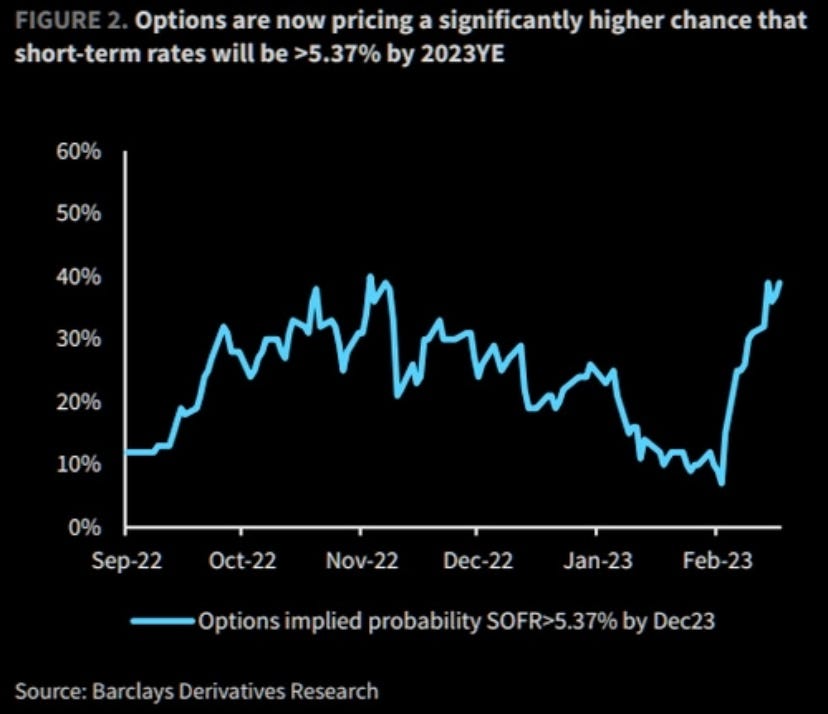
As usual, we will be closely watching US treasury yields this week. With the equity market looking like rough seas, yields are likely to keep rising. Another key factor driving up yields in our view is the increasing odds of the FED having to hike and hold rates above 5%. (As shown in Figure 5)
From a technical view, we expect the 5Y(FVX) yield to keep rising and to test the trendline from September 2022. As shown in Figure 6 FVX appears to be in a bullish ascending pattern.
The 10Y(TNX) as we predicted the past trendline from November 2022 has turned into a support area. The next important test for TNX we see is a clean break of the 4.0% trendline, which is shown in Figure 7. Currently, on the daily the TNX is about 0.19% from testing 4.0%, we see this price zone being tested throughout the week.
Finally, for the 30Y(TYX) yield we expect a possible test of the trendline from October 2022. It is more likely that TYX trades sideways this week. (Figure 8)
Possible Trades & Follow ups:
Before we get into this week’s trade setups we would first like to review our trades from last week. Our first trade idea from last week is still in play as FSLR reports its earnings on Tuesday, February 28th. Our short TLT trade certainly played out with TLT closing two trading days over -1.25% down. For our third trade setup if you took the short side of the EBAY earnings catalyst you could have made over 50% on puts. For our fourth trade idea, we recommend UVIX calls ATM which are now easily in ITM with profits over 40%!
This week’s possible trades:
Long USD-This trade is likely the most overcrowded of the trades we will cover. As such we will address it first, going long on the USD has been a solid trade for a long time. With the dollar having another rally last week and more fears about inflation being more sticky than originally thought. We believe going long USD is a good trade for this upcoming week, there are countless ways to put this trade on. We would recommend UUP calls or DX futures.
Long Volatility-With the previous trading week ending with high PCE data (more on this in the macro section) and the equity market likely continuing to fall, we believe this great trade. If you have long equity positions i.e. a stock portfolio this is a good hedge as well. Again there are countless ways to put this trade on, however, the best is VIX futures if you can afford the high margin requirements. If you cannot VIX calls or UVIX calls are also good ways to put on this trade, but we would recommend waiting for a pullback to get the max profit possible.
Short TLT-We believe this trade is likely to work again this week. We recommend waiting for TYX to drop (which will increase TLTs price thus giving you a better entry). We see TLT testing the 100 range this trading week. (Figure 10)
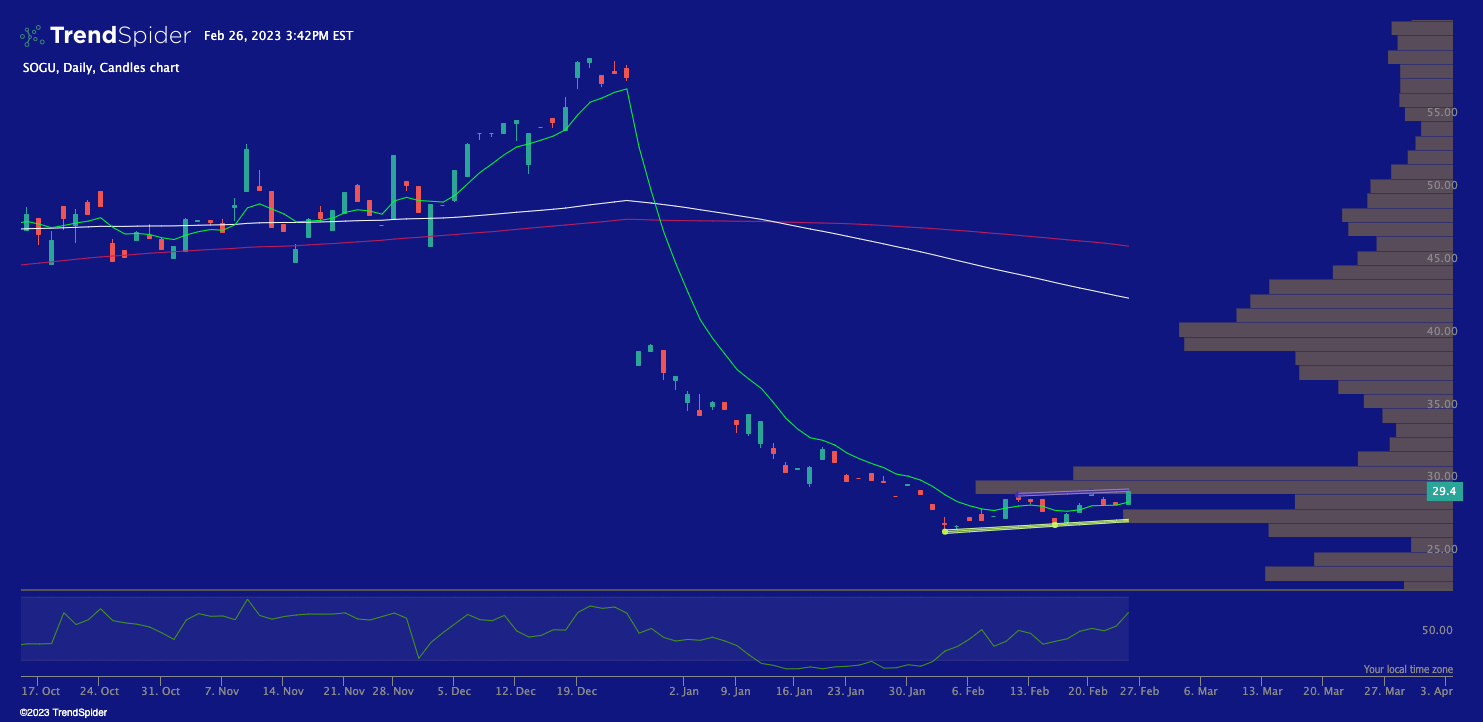
Swing SOGU-First if you are not familiar with this product or similar ETFs we recommend not attempting this trade. With that being said SOGU is an ETF to inverse the top 25 SPAC companies (by market cap) -1x daily. We believe SOGU is in a good spot from a TA viewpoint (Figure 11) and with the rising rate environment, it is likely these SPAC companies will keep dropping in price.

Macro overview & Our view:
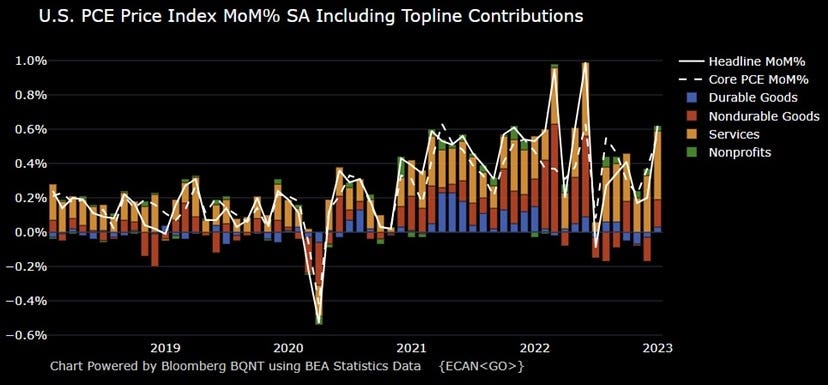
For this week’s macro overview, we would like to first focus on inflation. With the hot PCE print on Friday as shown in Figure 12. This is concerning as it shows inflation might not be so easily tamed.
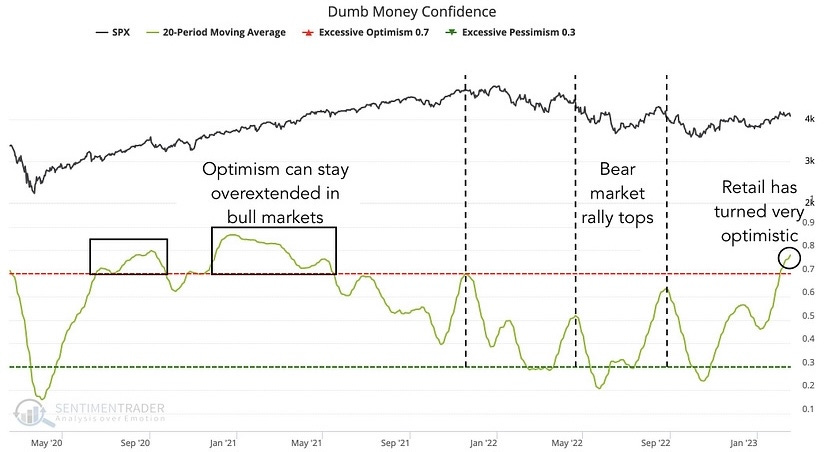
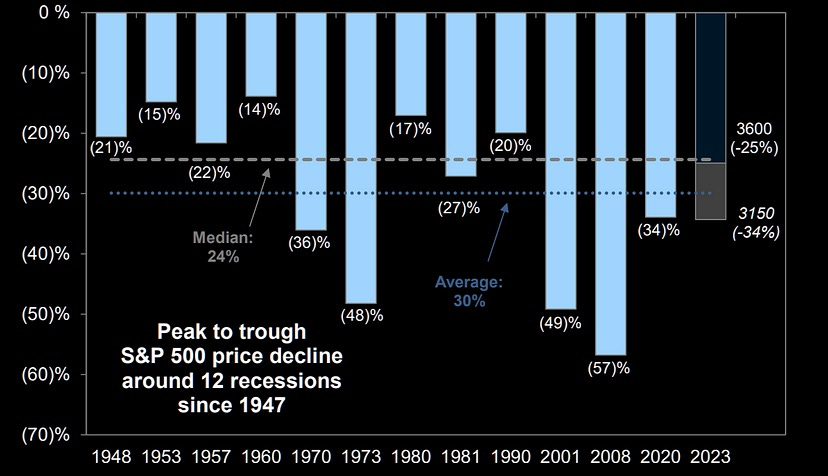
Finally, to finish up this week’s Market Malarkey we will end with a couple of charts. The first of the two, Figure 13 shows what we believe is more proof that the beginning of the year rally was nothing more than a bear market rally. With that being said the final Figure in this week’s write-up is the projected S&P price in two scenarios. The first is the peak-to-trough price in the S&P projected by calculating 12 recessions since 1947. (Figure 14) This model shows a low price of 3600 for the S&P. The second projected price in Figure 14 is what one might consider the “hard landing” price. With the model showing a decline in the S&P of -34% to a price of 3150.
DISCLAIMER: We are not Financial Advisors, and all information presented is for educational purposes ONLY. Financial markets can be extremely volatile, as such using good risk management is a must.