


The Week Ahead: 7/16-7/21
Get ready for this trading week

Calendars for the week of 7/16-7/21:
Economic Calendar for 7/16-7/21:
US Equity Market Earnings Releases for 7/16-7/21:
Summary of key events this week:
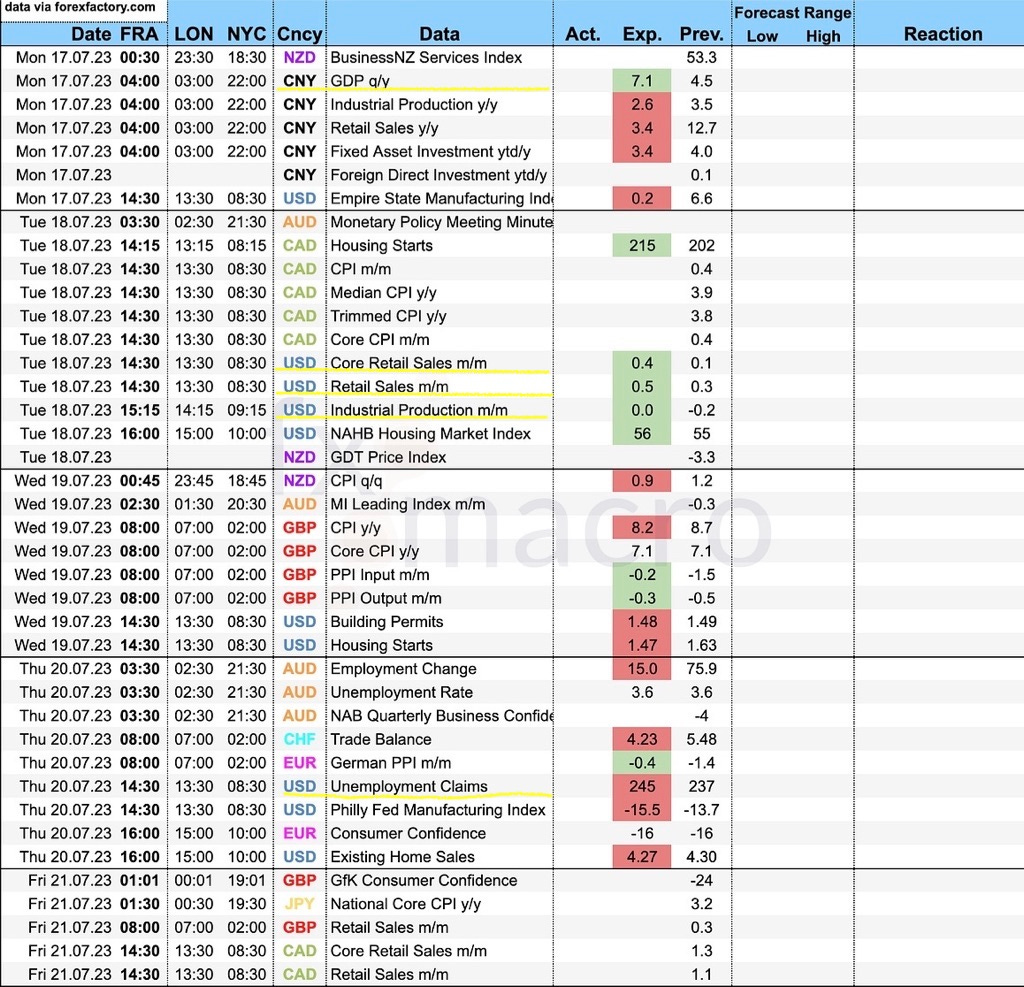
Overall, this week is a quiet one for economic data prints. On Sunday the 16th at 10pm EST, China will be releasing a cavalcade of economic data. (Figure 1) It is our view that the most important release when it comes to possible moving markets will likely be industrial production YoY. (Figure 1) We believe that a surprise print to the upside for industrial production YoY in China could help drive the price of crude up & vice versa. (More on this later) On Monday the 17th the Empire State Manufacturing Index at 8:30am EST. (Figure 1) For Tuesday the 18th at 9:15am EST, we have Retail Sales MoM, and Industrial Production MoM for the US. (Figure 1) On Thursday the 20th there is unemployment claims for the US. Also make sure you check out
and subscribe if you’re not already. He does a great weekly market preview along with a review of CB speakers across the world, we highly recommend his publication.Now onto some earnings we will be watching this week.
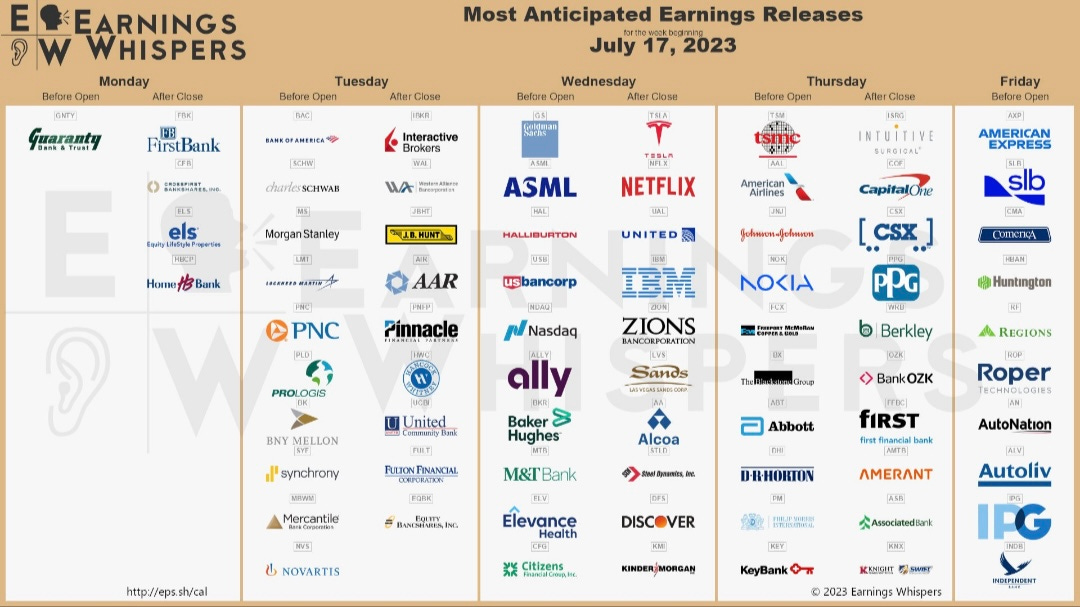
Tuesday BMO- BAC 0.00%↑, PNC 0.00%↑, LMT 0.00%↑. Forward guidance from the banks is likely to be a key driver in the US equity market.
Wednesday BMO- GS 0.00%↑, USB 0.00%↑.
Wednesday AH- TSLA 0.00%↑, NFLX 0.00%↑, ZION 0.00%↑. TSLA 0.00%↑ and NFLX 0.00%↑ are likely going to be extremely volatile. It is our these ERs will provide some context to how market participants are feeling about AI.
Thursday BMO- TSM 0.00%↑, AAL 0.00%↑, JNJ 0.00%↑, KEY 0.00%↑.
Friday BMO- AXP 0.00%↑, RF 0.00%↑, CMA 0.00%↑.
We view this week as the real kick off for this quarter’s earning releases. Remember forward guidance is usually what the market is looking for.
Word on The Street:
This is a new idea for us that we are excited to share. Word on The Street will include notes from Wall Street’s firms, banks and researchers. We hope you enjoy this addition and let us know what you think in the comments!
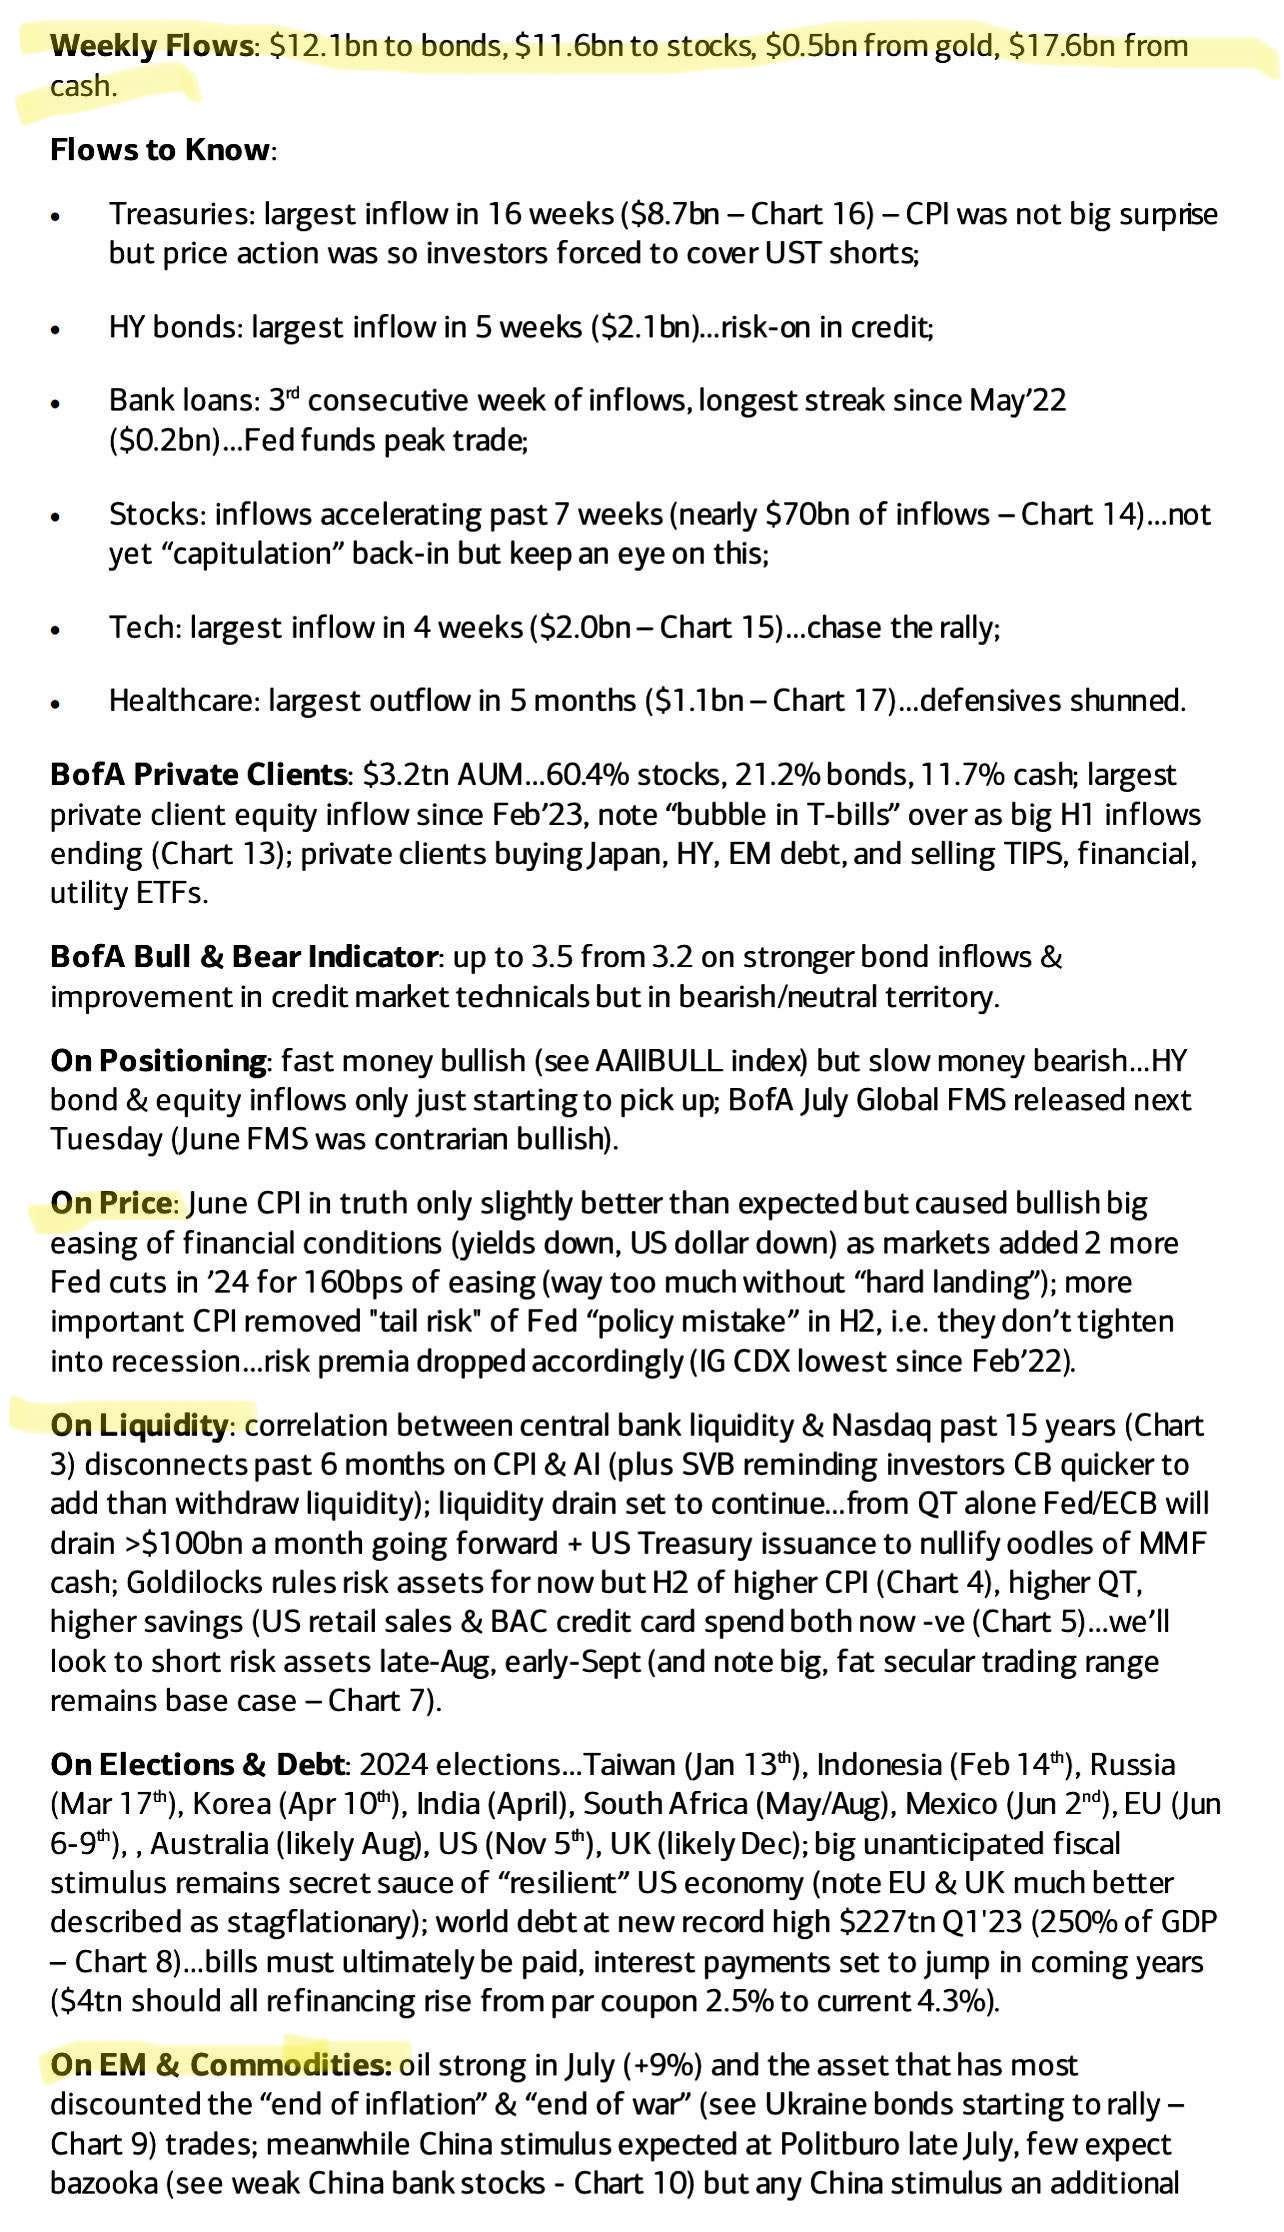
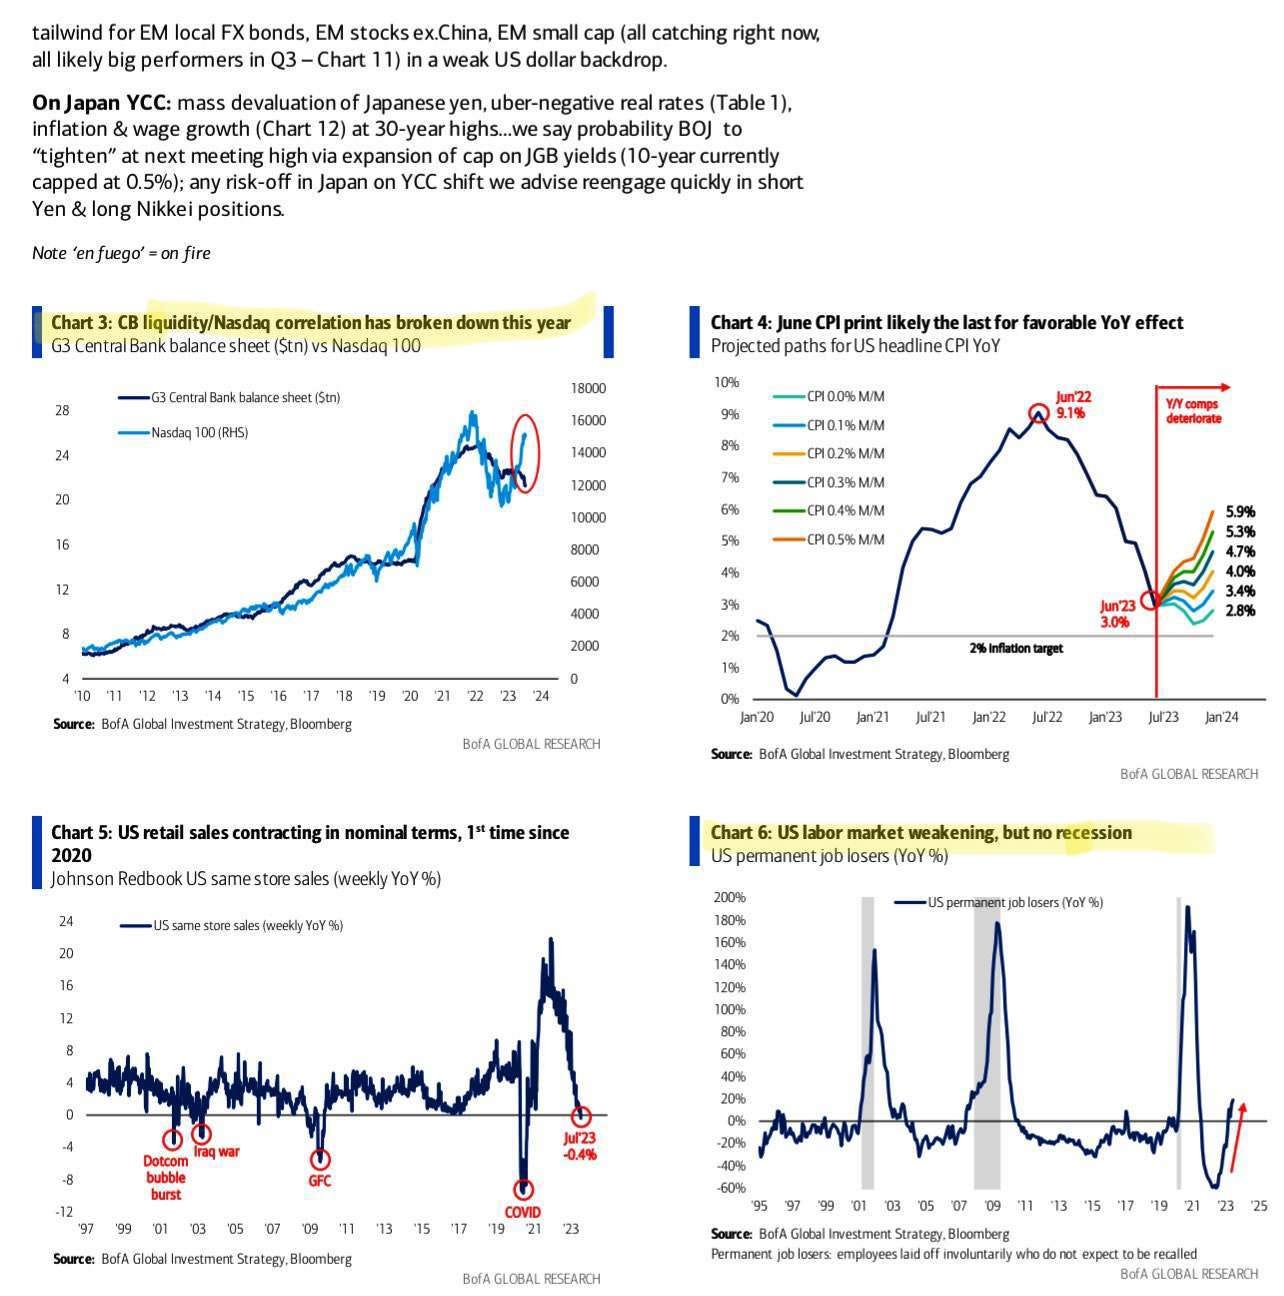
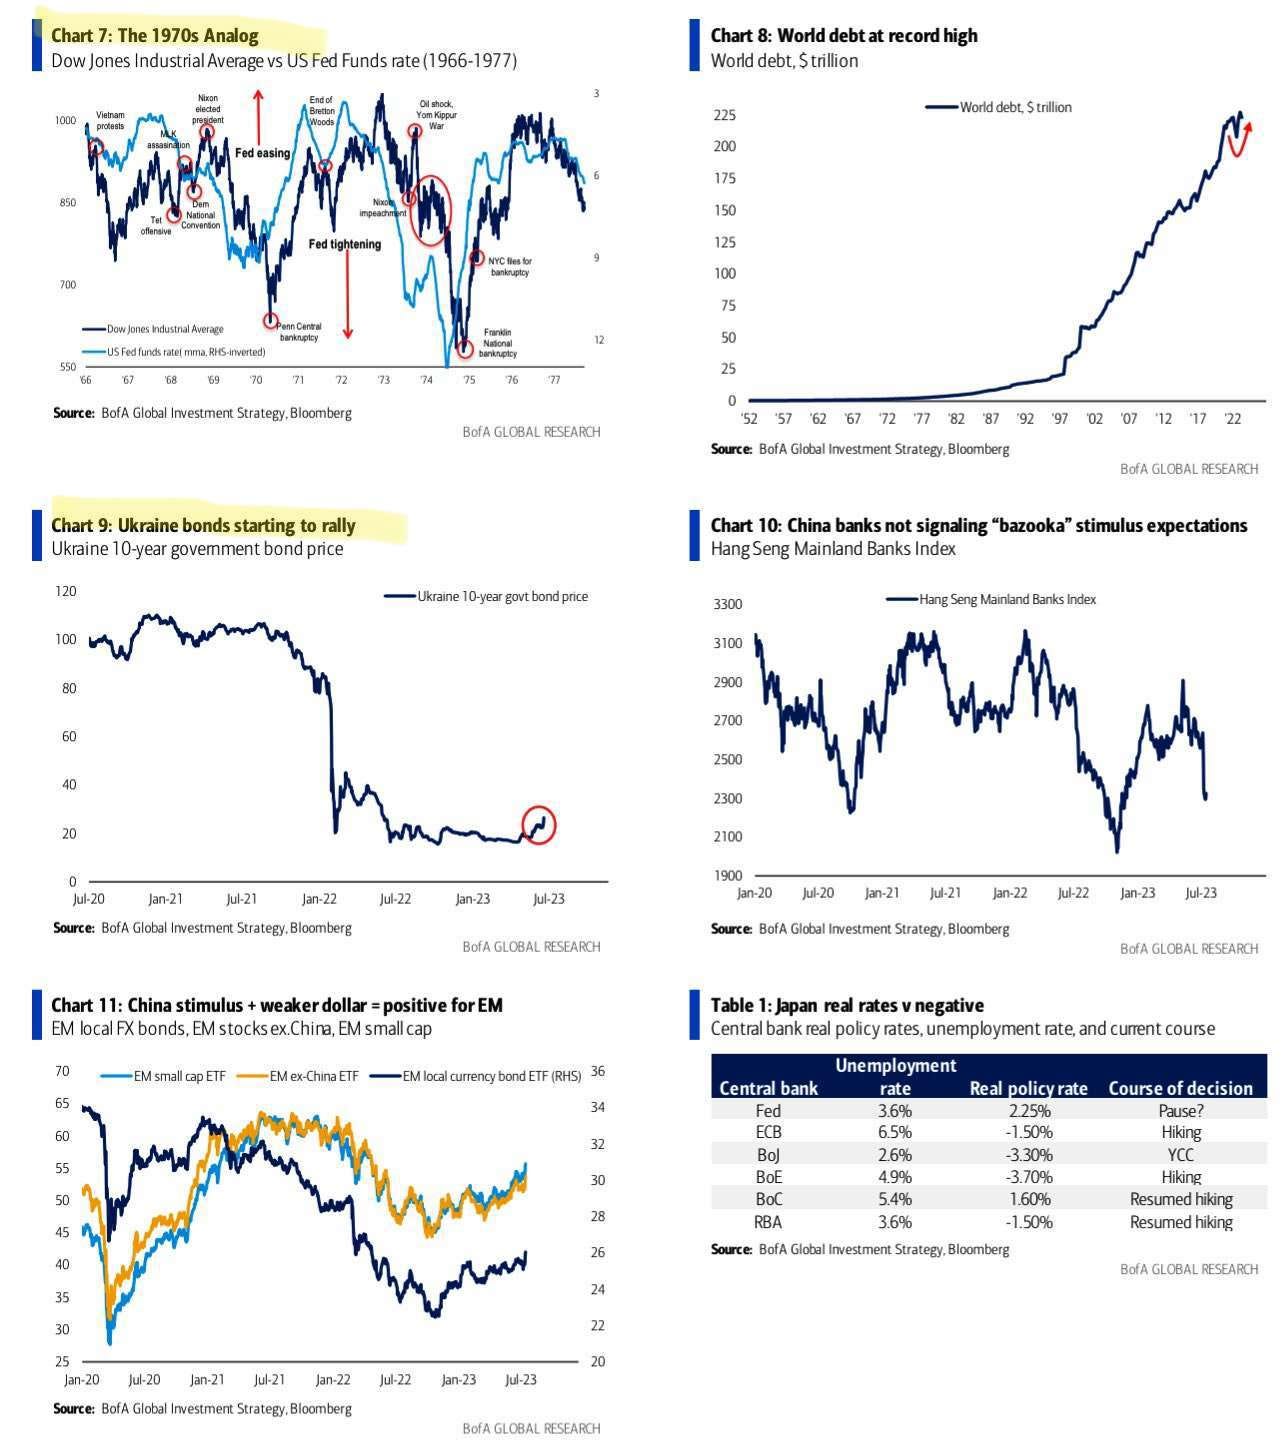
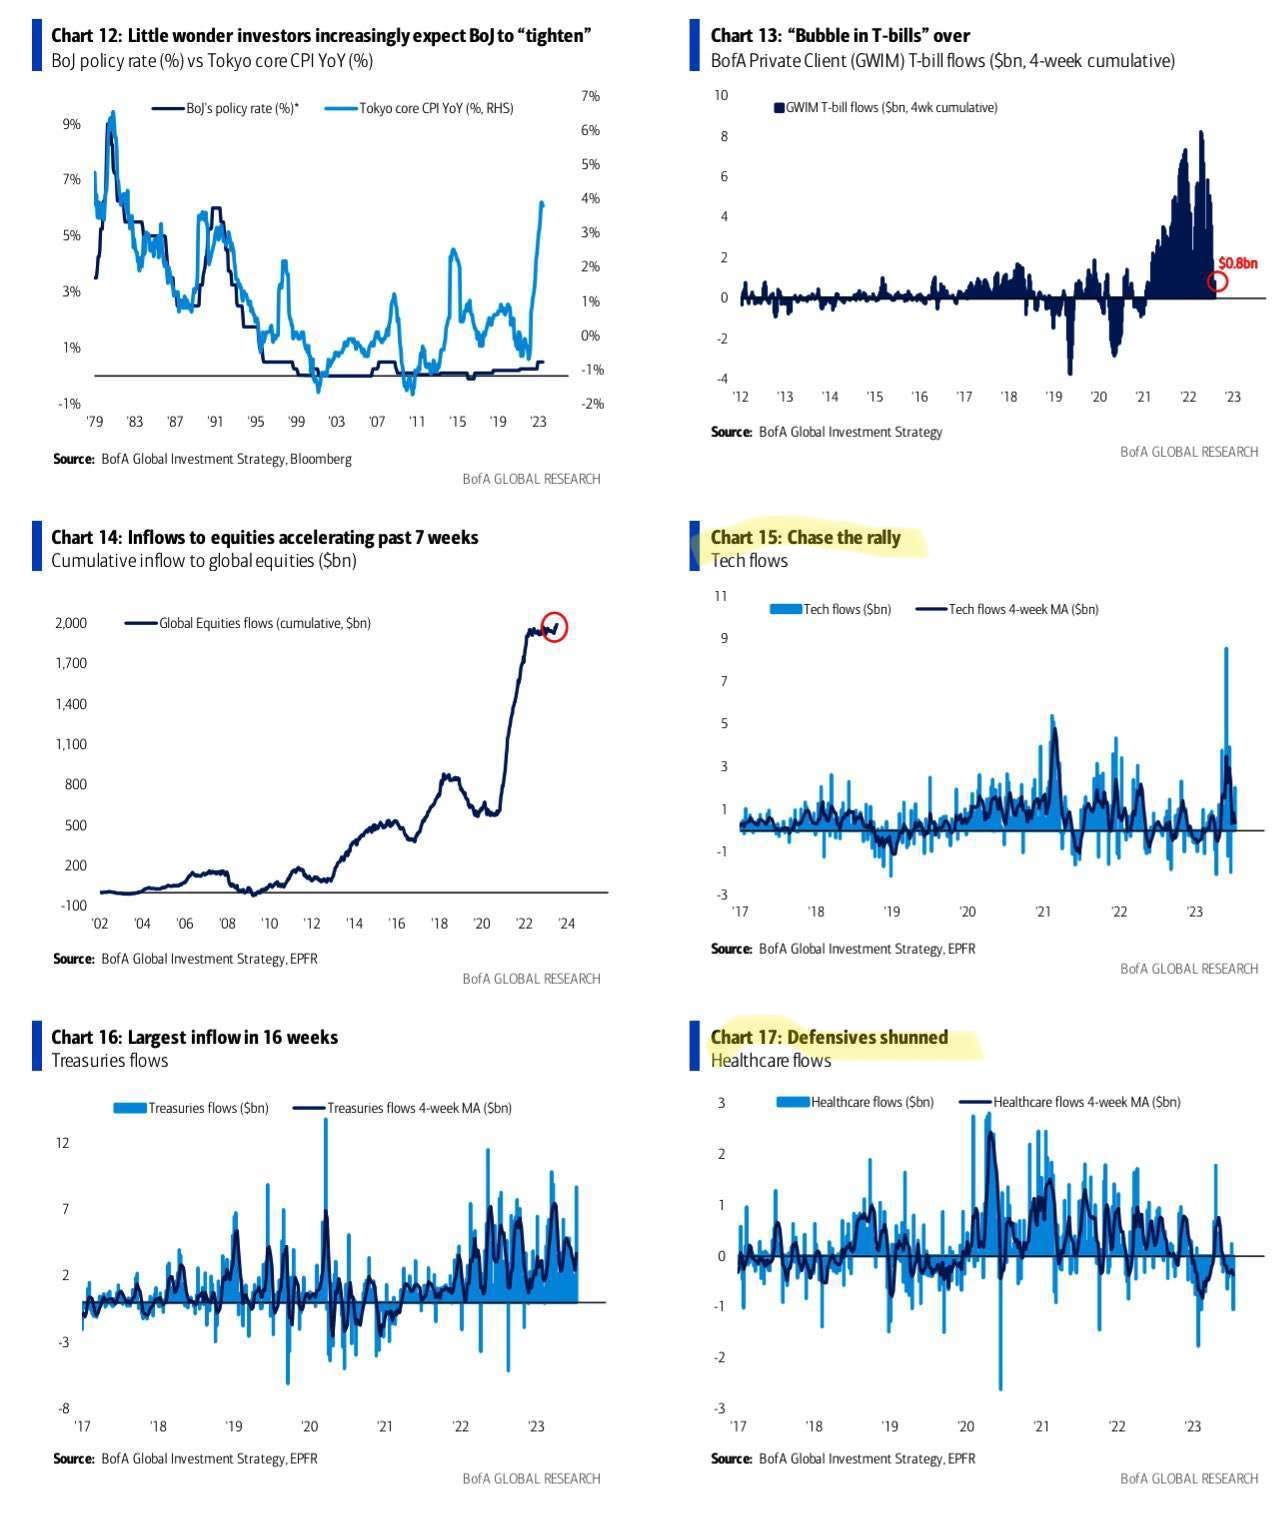
BoA Flow Show-
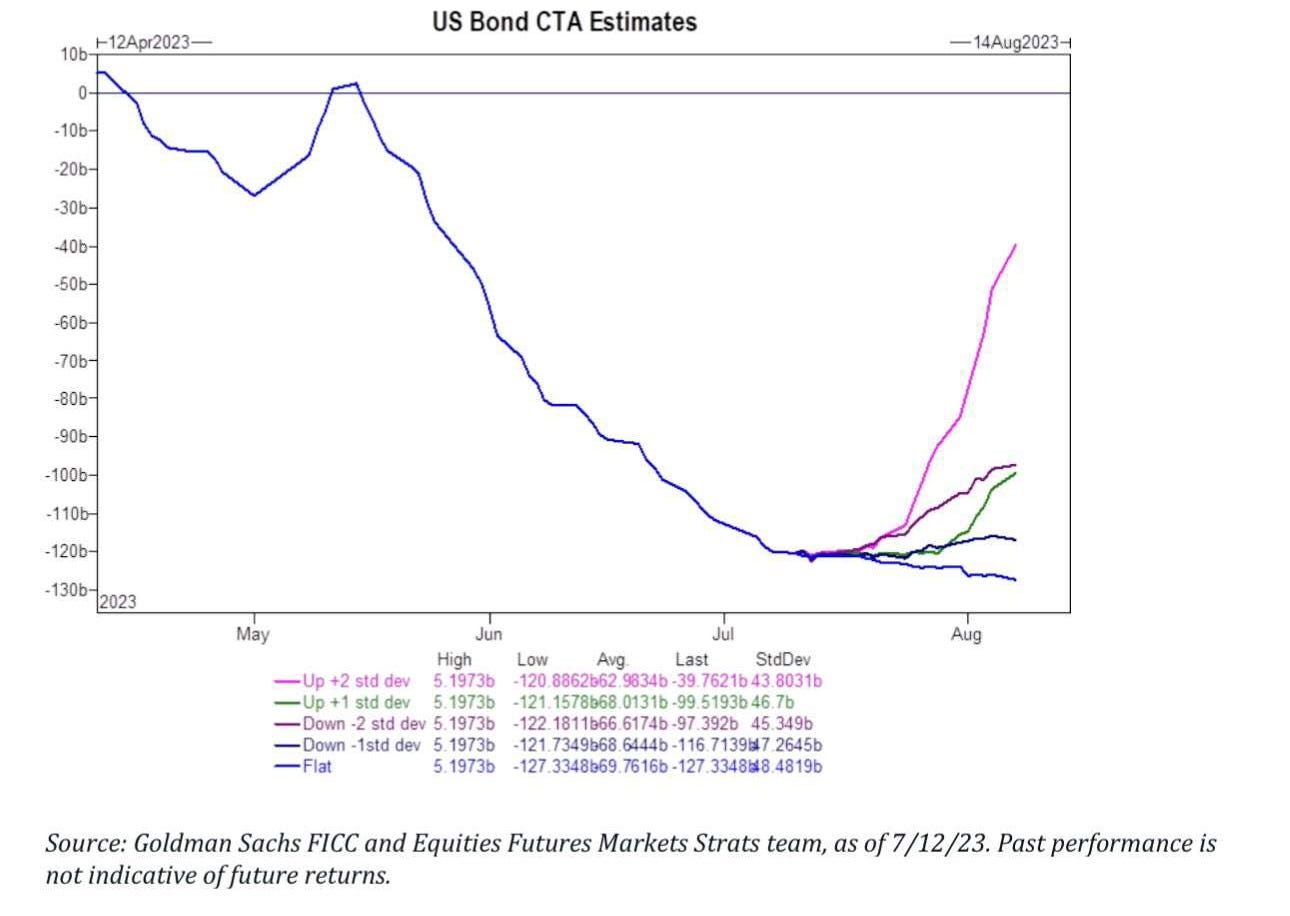
GS Tactical Flow-of-Funds-
Global Bond Re-Leveraging? A typo? Is this the most important chart of my deck today for global wall street? That is +$219 Billion worth of bonds to buy over the next 1-month in an up big tape, after selling -$94 Billion over the past 1 month.
Global CTA Bonds:
Over 1 week:
Flat tape: -$6.4B to sell
Up tape: +$5.0B to buy
Down tape: - $7.9B to sell
Over 1 month:
Flat tape: -$44.2B to sell
Up tape: +$219B to buy
Down tape: -$1.5B to sell
Bad breadth no longer: Got Listerine? If you have not already added RSP (SPX Equal) or QQQE (NDX Equal) to you radar, now is a good time. The flows are swarming here.
a. RSP (Equal Weight SPX has had inflows in 26 of the last 28 sessions…now home to +$3.9B in inflows over the past month (top 10 in YTD ETF league tables, + $5.4 B)
b. QQQE (Equal Weight NDX) has also seen an uptick in demand…with the fund registering its largest inflow ever in the past.
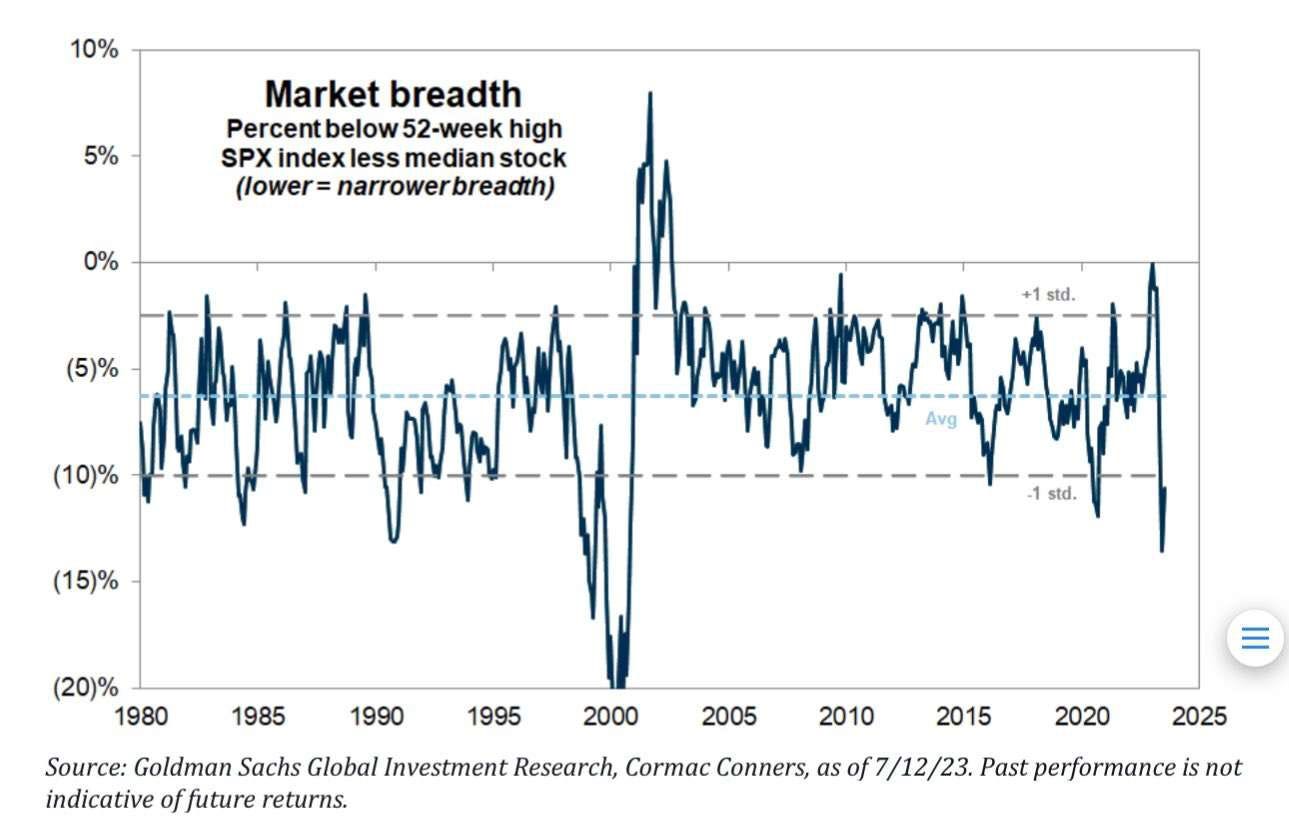
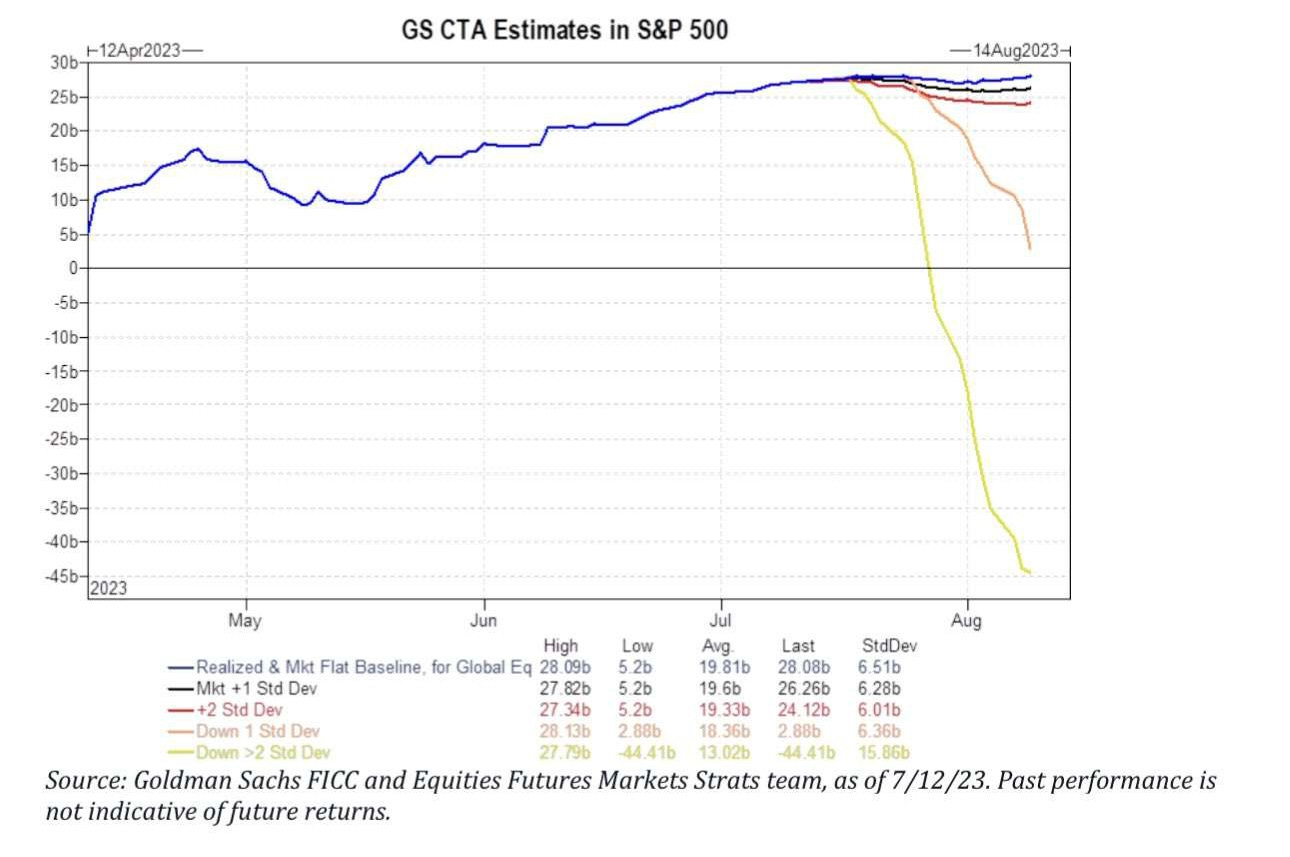
Equity CTA's remain long and have downside skew, but the ball needs to start rolling downhill first.
Global Equity CTA Update:
Over 1 week:
Flat tape: -$14.5bn to sell (+$1bn to BUY in S&P)
Up tape: +$8.9bn to buy (-$1bn to SELL in S&P)
Down tape: -$38.5bn to sell (-$2.4bn to SELL in S&P)
Over 1 month:
Flat tape: - $14.5hn to sell (+$1bn to BUY in S&P)
Up tape: +$72bn to buy (-$3bn to SELL in S&P)
Down tape: -$209bn to sell (-$72bn to SELL in S&P)
Trade Ideas:
Now we will share some possible trade setups if this week and beyond.
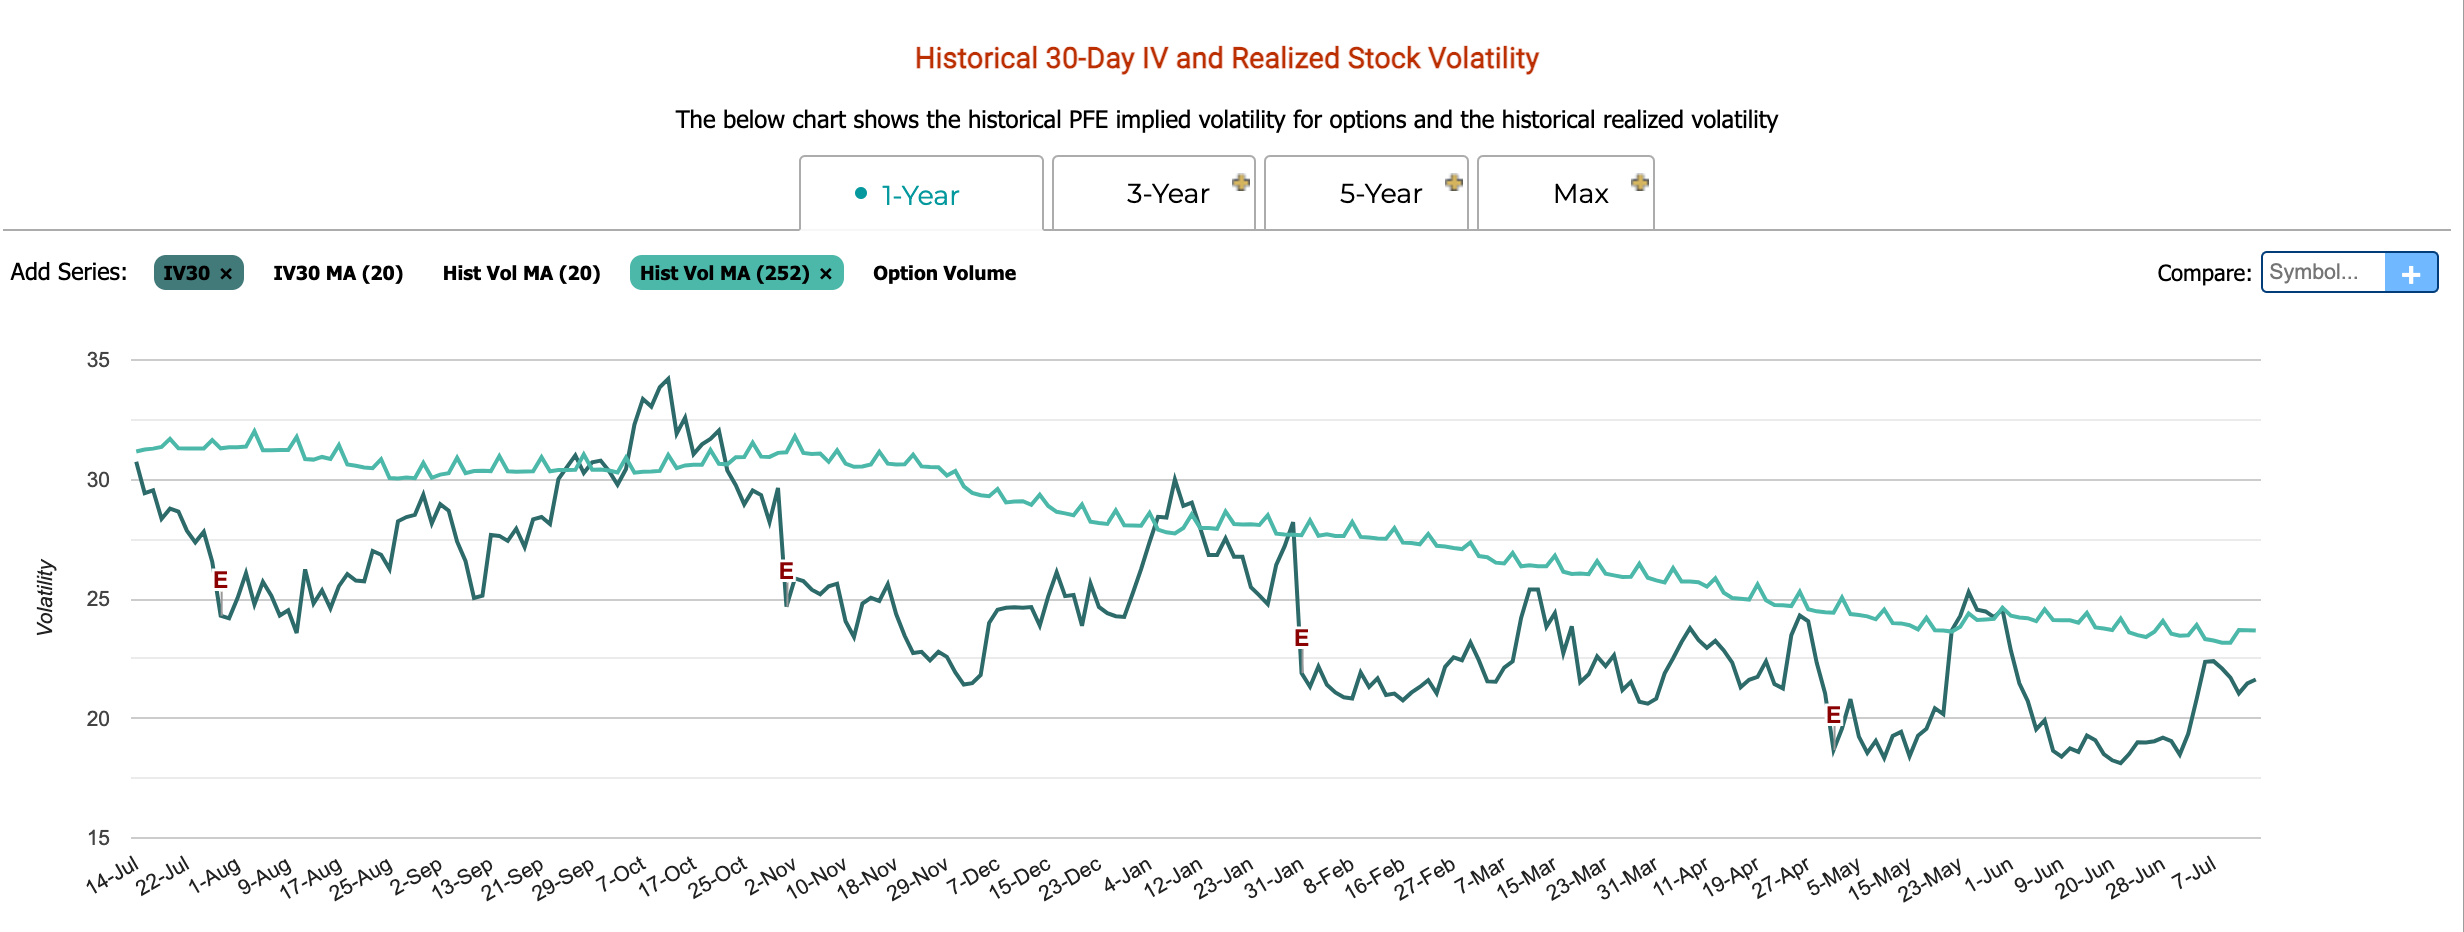
PFE 0.00%↑- 36/36 Straddle expiration 8/4/23. Our idea is a rather simple one, PFE 0.00%↑ will announce earnings on August 1st BMO. The implied volatility (IV) is currently 2.8% below the stocks 52W IV average. (Market Chameleon) This trade could collect profits on the increase in IV that is common during the lead up to an ER.
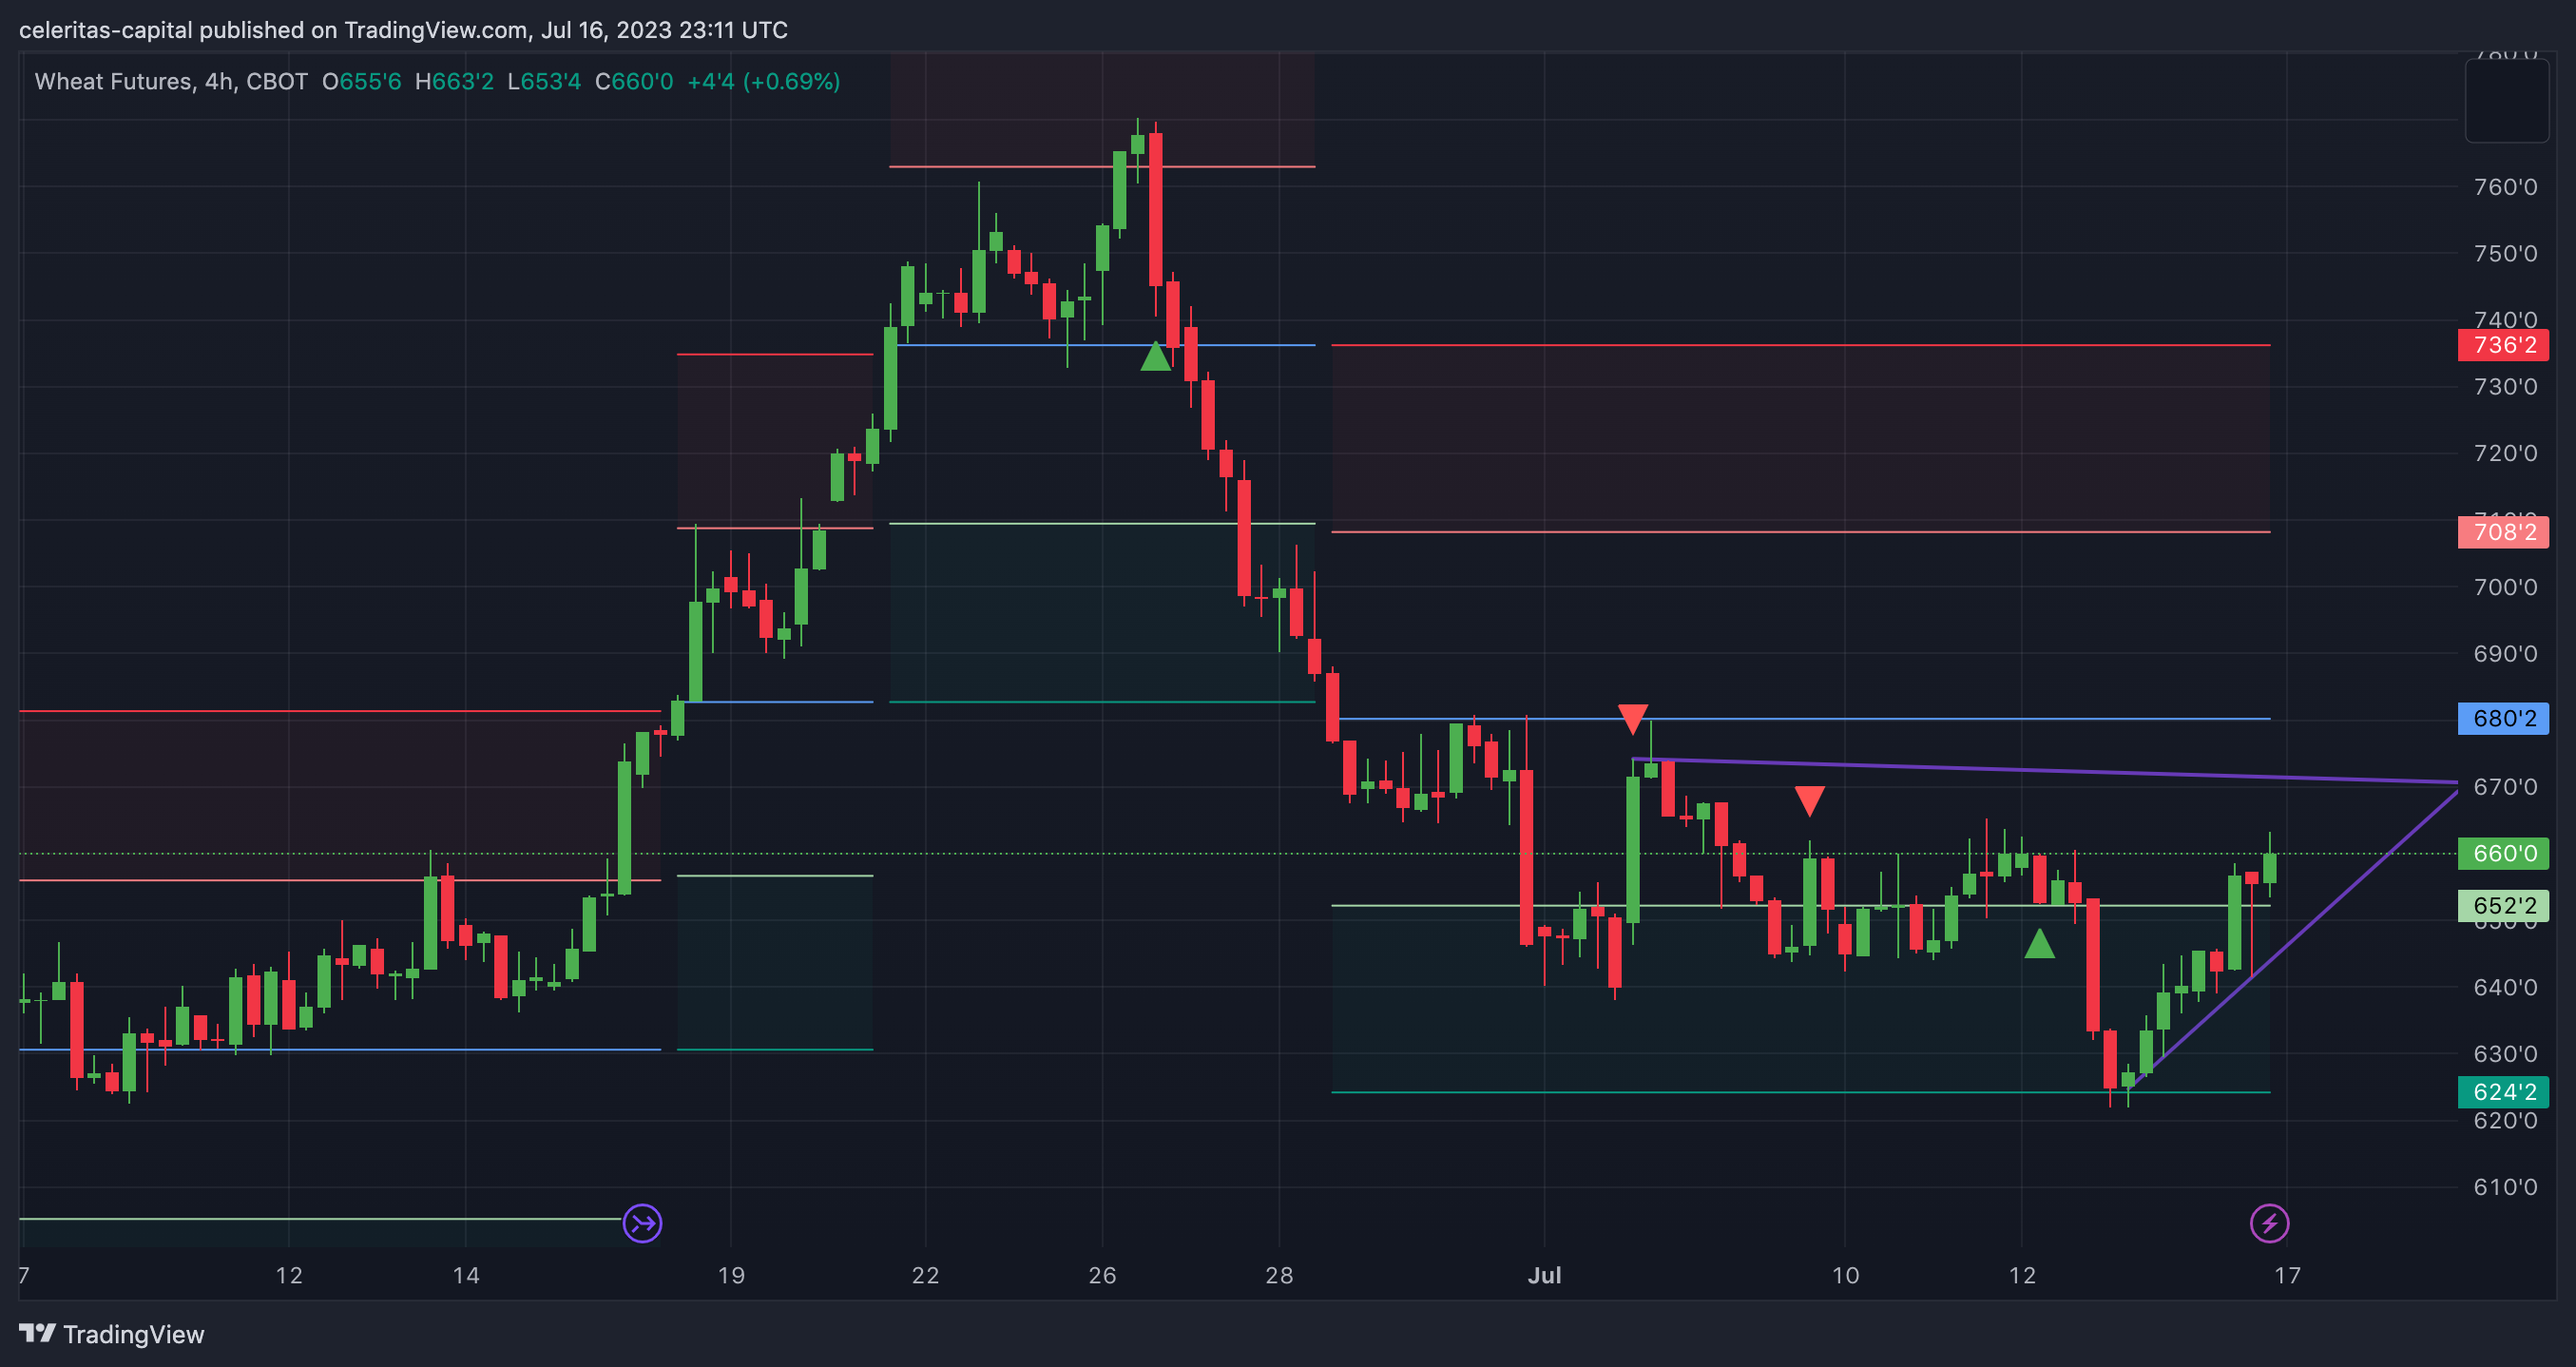
Short Crude- Crude oil (CL) has fallen through the bottom of a solid trend channel that started around the 5th of this month. (Figure 11) Below in Figure 11 we outline how we are looking at the R/R on a possible CL short. If Chinese industrial production comes in under expectations it is our view that CL will likely see more downside.
Long Wheat- Wheat seems like a good long here. With the news of the Black Sea grain deal falling apart we see more upside for wheat. We plan on expanding on this idea in the very near future.
Thank you for reading! We hope you found this article helpful, if you did we would appreciate if you could share this article.
And as always we welcome any feedback in the comments.
DISCLAIMER: We are not Financial Advisors, and all information presented is for educational purposes ONLY. Financial markets can be extremely volatile, as such using good risk management is a must.
nice take, thank you!