
The Week Ahead (3/16/2026)
Prepare for the busy week ahead with this post tackling ES positioning in options, breadth, skew and much more. Powered Using: QuikOptions, QuikStrike, VS3D, QuikVol and more.

Hello everyone welcome back to Celeritas Capital I am just doing a quick week ahead post for the upcoming week of 3/16/26-3/20/26. This is unlikely to become a weekly thing as I have new commitment that will be taking up a lot of up time for the foreseeable future but I know it will make both my life and Celeritas Capital much better. Final note this post is inspired by Yamco and his weekly posts, the latest you can find below. I think I added some important data and I made this for Futures traders primarily. Now let us get started! (Note this article is best read via Substack using the website or app.)

The Week Ahead:
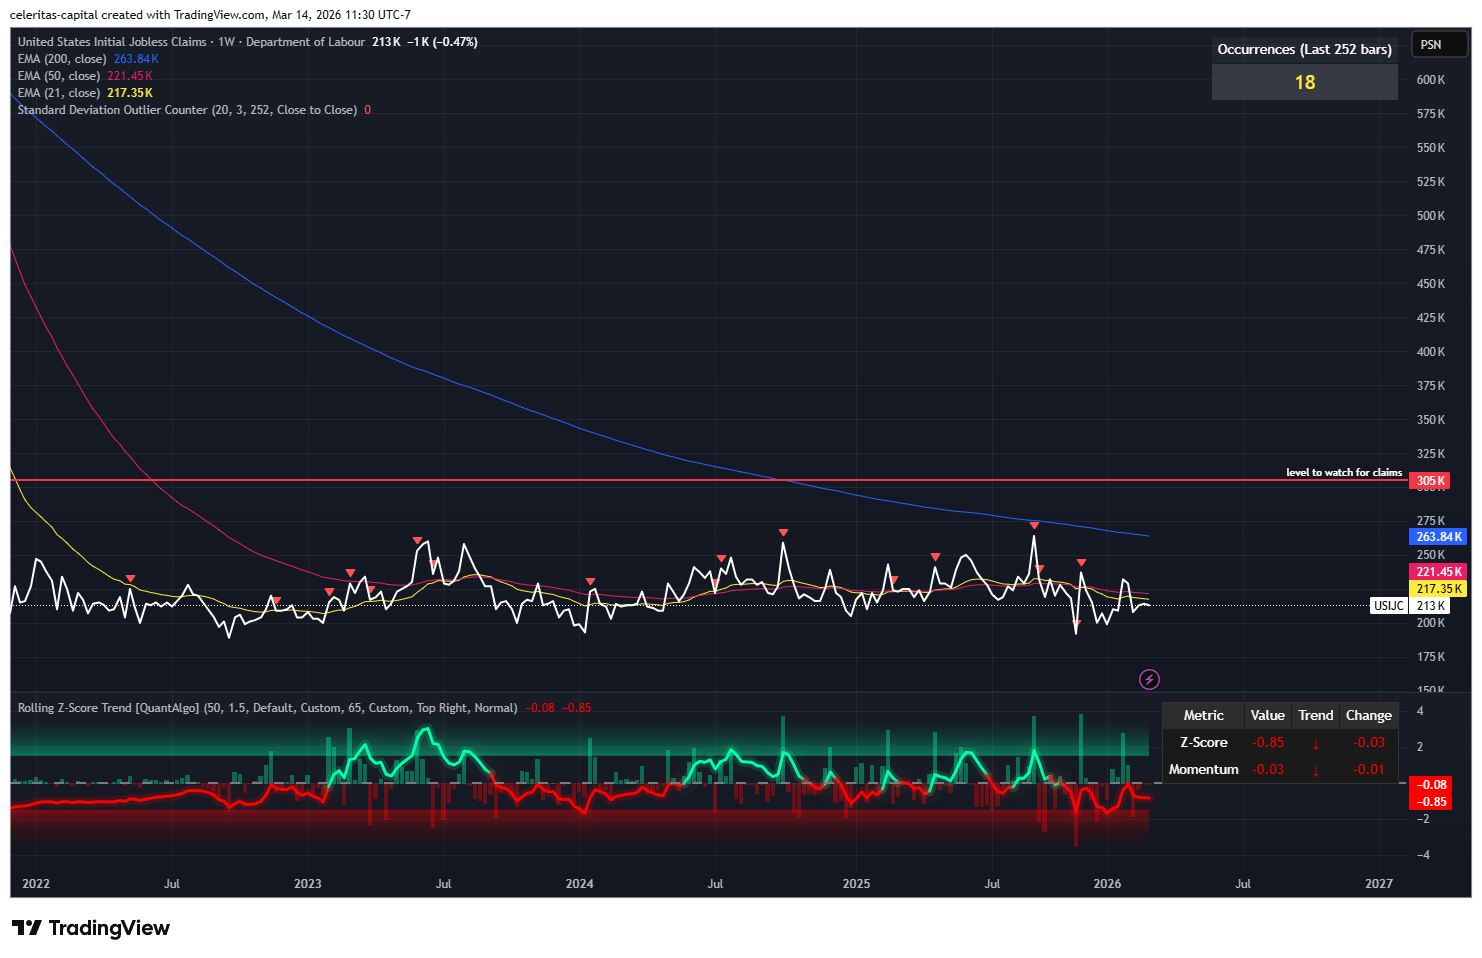
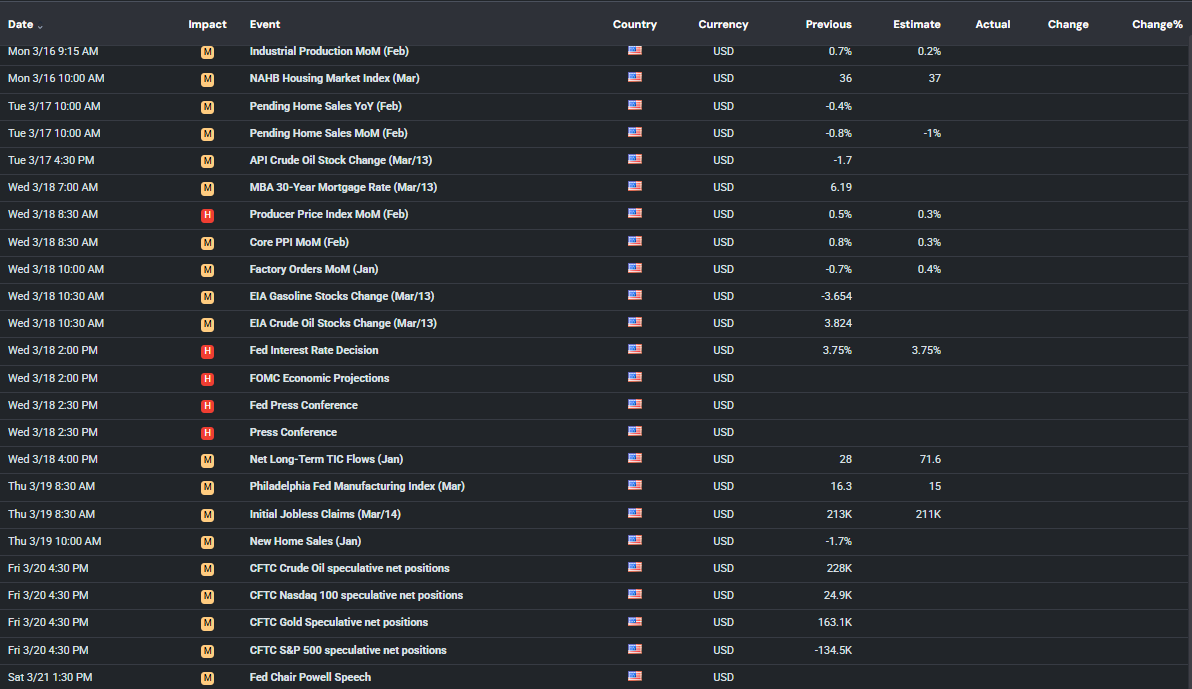
This week is sure to be an interesting one with a FED meeting. Which is likely to be a nothing burger overall but if you watch rates I think important sentiment from FED members might be gained via disneters, etc. Then on Thursday we have Initial Jobless Claims. I expect that we stay under the the scary red line of 305k which is still quite a ways out more proof the US labor market is not all doom and gloom. (Figure 1) In fact I think we print below one standard deviation upwards about 221 k jobless claims is my calculation. I forgot to mention that Wednesday morning 3/18, we get PPI in the morning before the FED meeting.
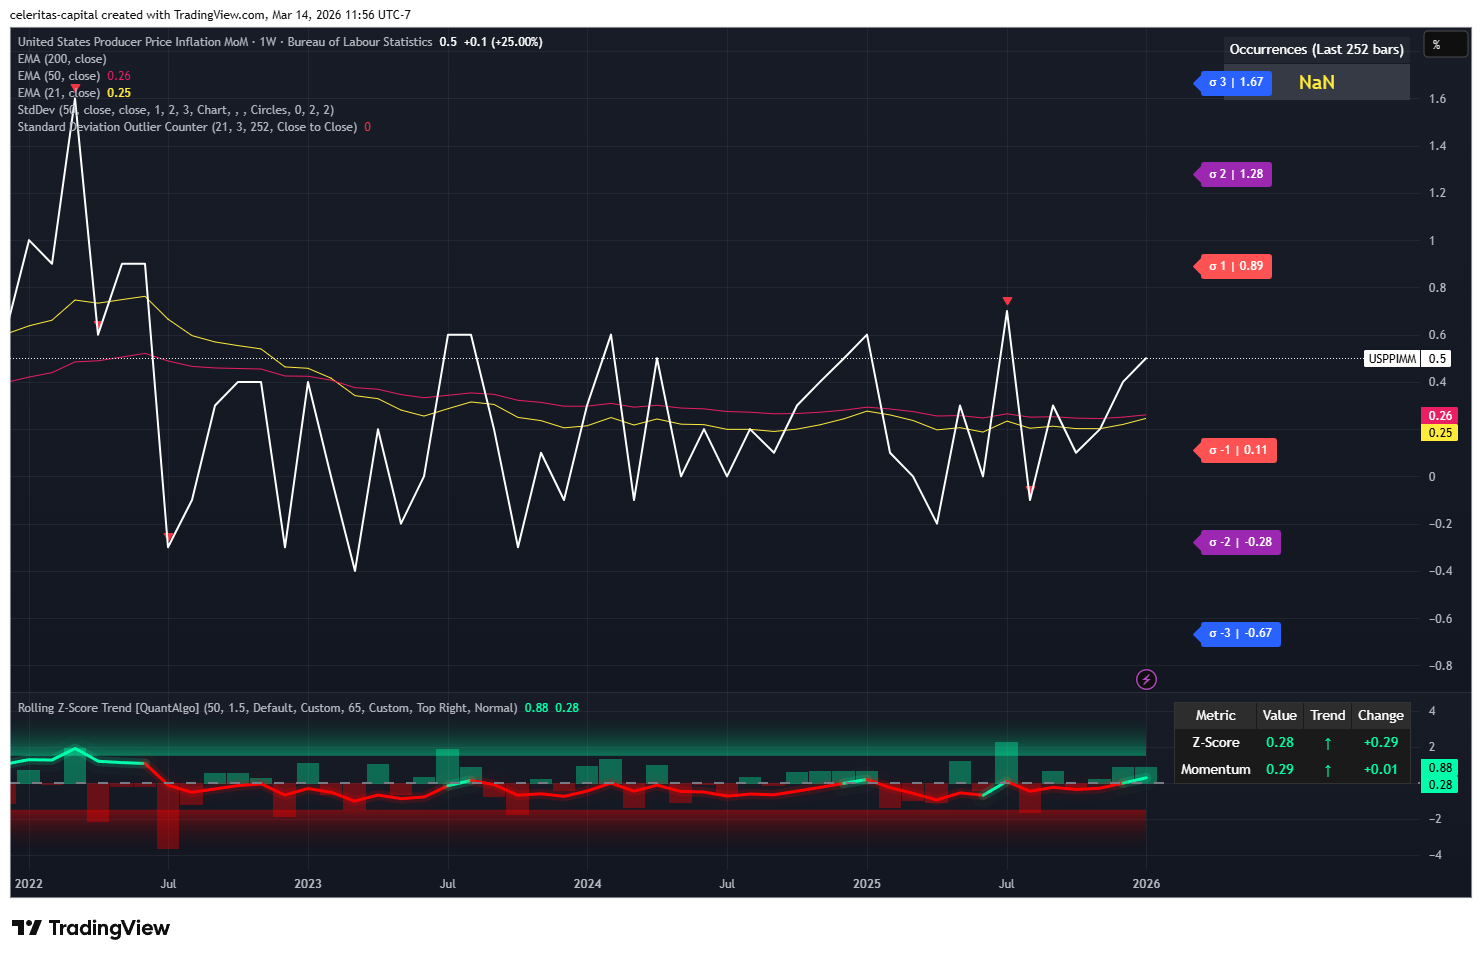
All things considered I see the PPI coming in hot MoM and it would not surprise me if we saw it print near one standard deviation upward (aka 0.89% MoM). That level hasn’t been seen since mid 2022 so I don’t expect the print to by near the standard deviation just something I thought I would note. (Figure 2) Of course the FED meeting what everyone is waiting for this week. So let start with straddle pricing for the week.
ES Straddles:
ES Straddle Pricing for next week and beyond:
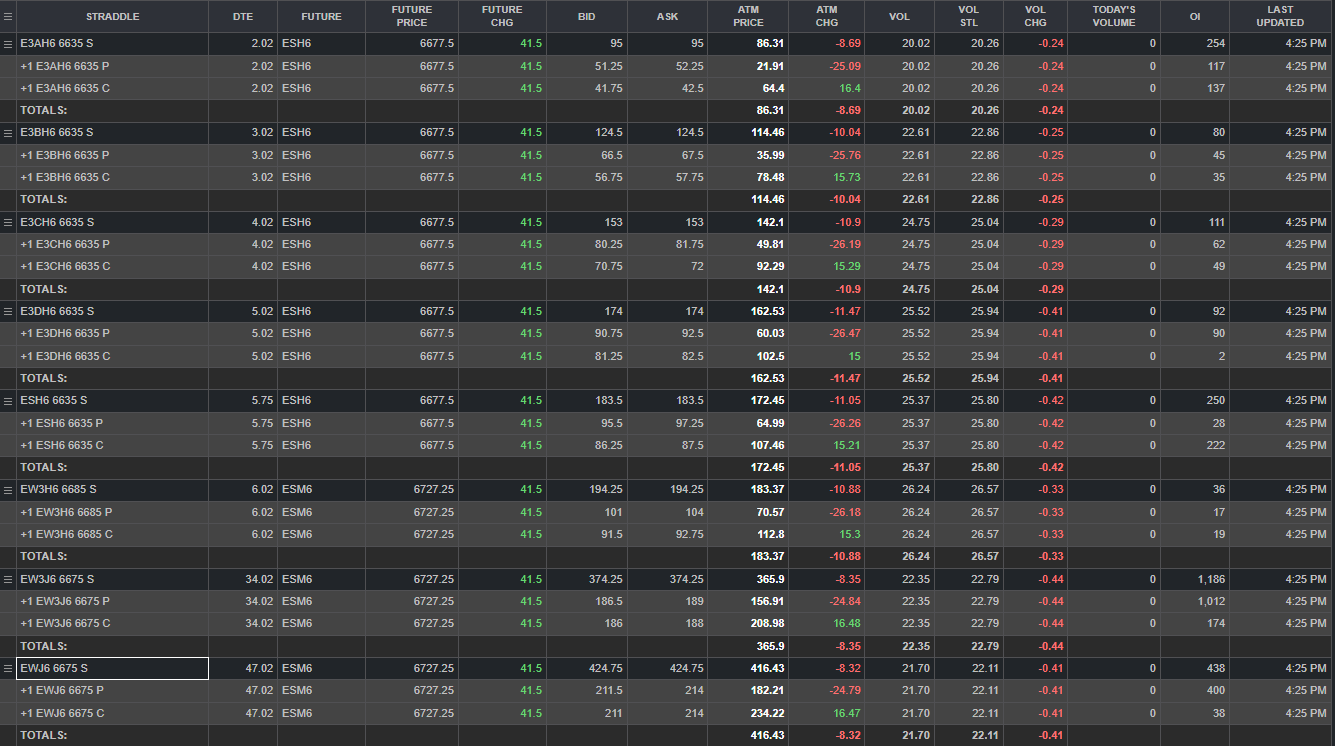
If you are not similar with how straddle pricing works don’t worry just find the DTE (Days Until Expiration) column. Look at the ATM price, let us use 3.02 DTE the ATM price is 114.46 so you take that number and add it the current price of ES for the upper bound and vice versa for the lower bound. (Figure 4) Note that the way I explained how to calculate the expected move from straddle pricing is the ‘back of the napkin’ way of doing it.
Sentiment and Exposure:
Let’s take a look dealer positioning for SPX options, ES Risk Reversals, ETF flow and the ES Vol surface. Let’s dive into it.
VS3D Positioning:
First I have to say if you are not in the weeds of dealer positioning for SPX options and by that I mean you understand the basics. But if that isn’t you perhaps just skim this section as misreading the context could do damage your trading. Explaining SPX option dealer positioning is one above my knowledge gap and two above my pay grade. If this interests you at ALL I recommend following VolSignals on Twitter(X) and check out both the Youtube and website. I get no compensation for sharing either VolSignals or QuikStrike/QuikOptions, both companies partcaily the founders of both have already taught me a BOAT LOAD of things so sharing the great products they provide is the least I can do.
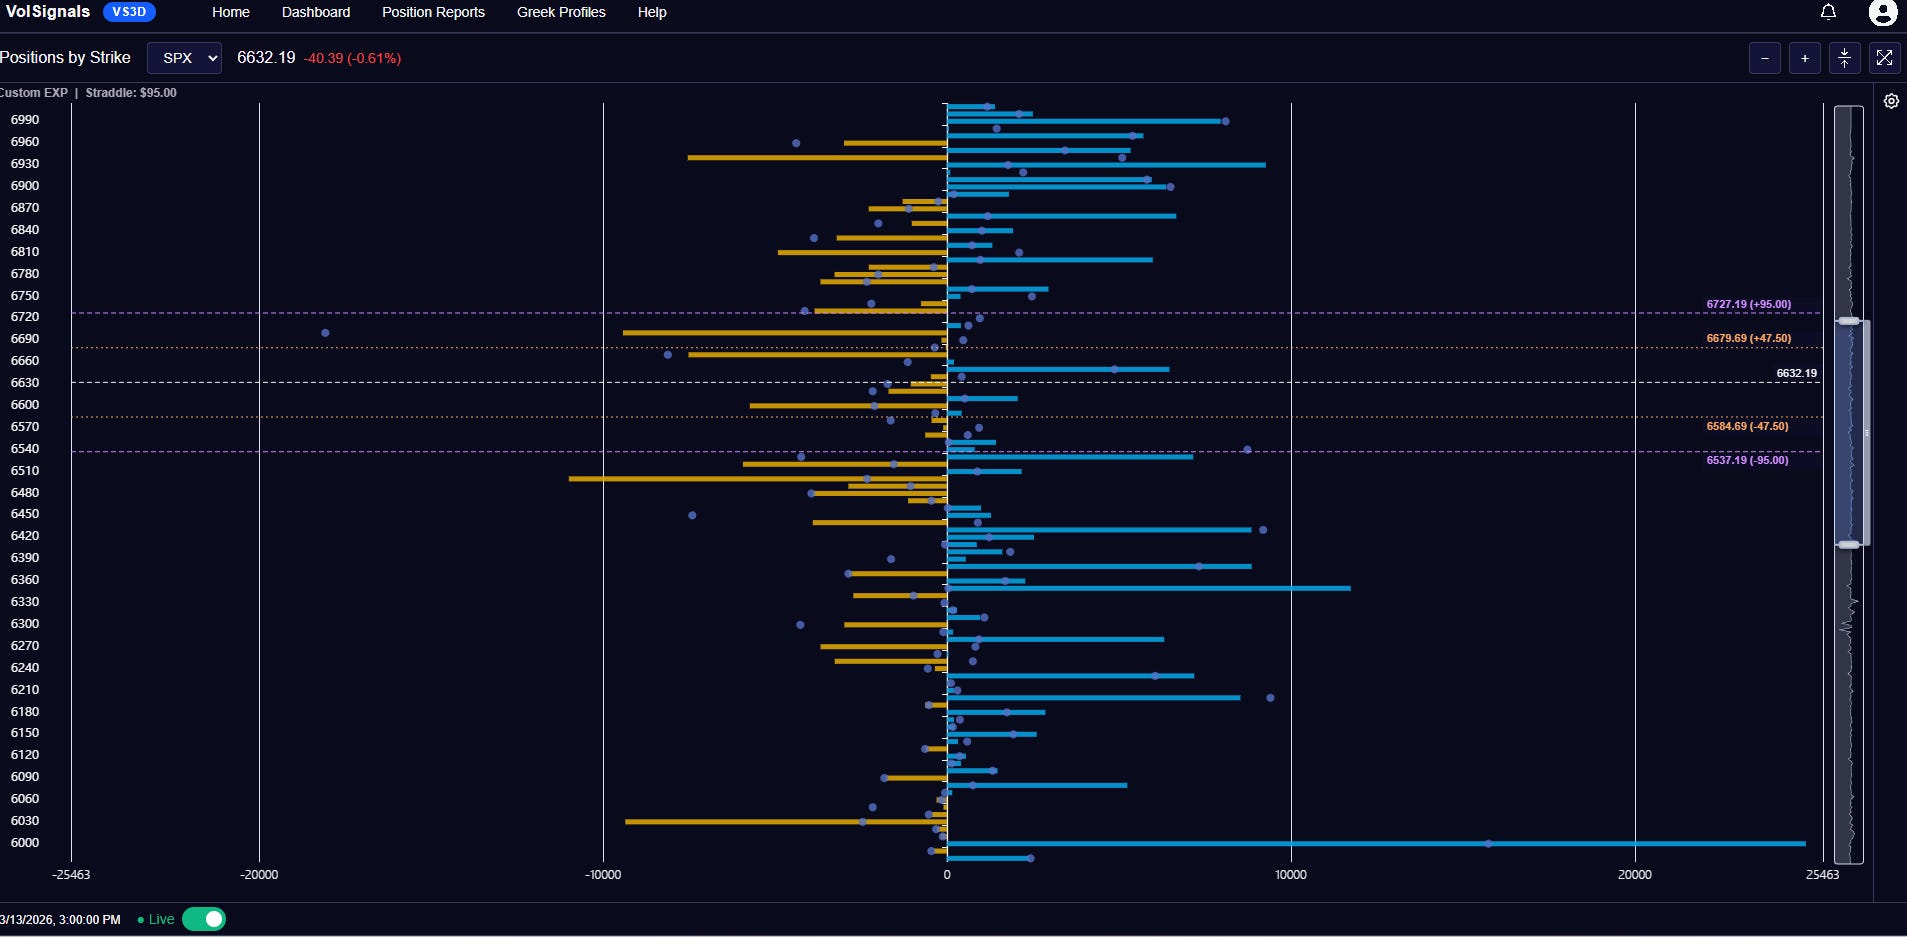
Now looking at the position by strike tool by VS3D you can see every 10 strikes along with MMs exposure at the strike. The blue bars are dealers being NET long options at that strike (don’t worry about calls or puts right now) for example the long blue bar at the bottom of Figure 7 is the 6000 strike in which dealers a long more 20,000 units there. The yellow bar is when dealers are NET short options at a strike. (Figure 7) If you have questions leave a comment and I will try to help and if I can’t I will try to point you in the right direction.
NOTE THAT THE NEXT FOUR SECTIONS HAVE BEEN WRITTEN BY CHATGPT SO TAKE WITH A LARGE GRAIN OF SALT. As LLMs are known to have difficulties with esoteric financial market stuff. That said I agree with this analysis based on my fairly limited time trading SPX options as a retail trader. (Which basically means big grain of salt like I said before)
Key Levels & Take Aways:
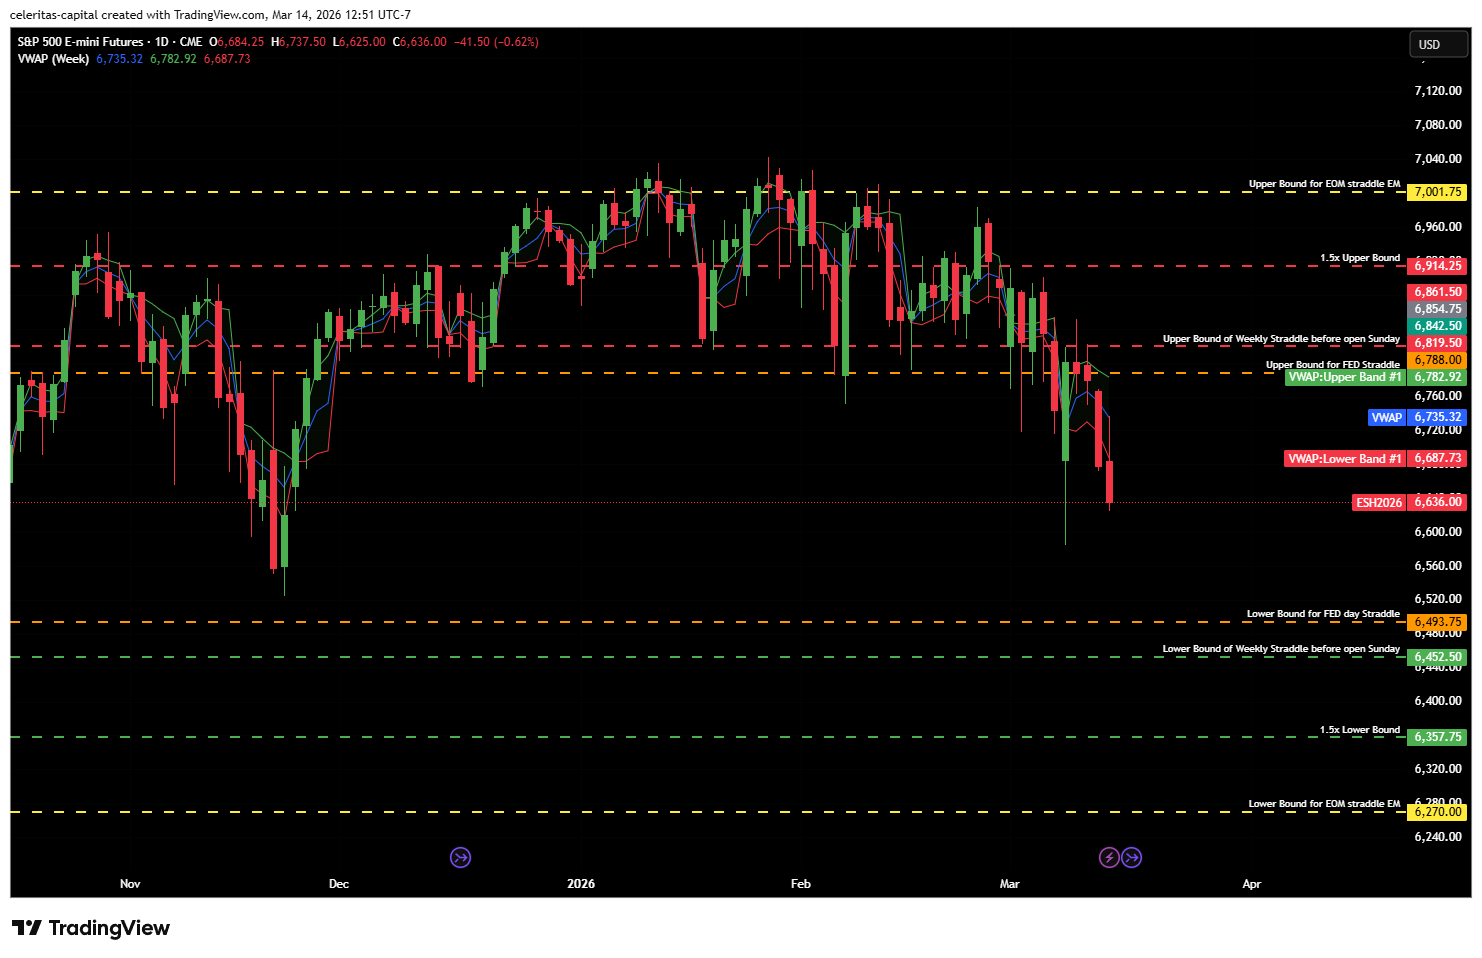
With all of this week’s expiries loaded, the market looks far more anchored around the 6600–6690 zone, with the biggest nearby pivots still clustering around 6600 / 6630 / 6660 / 6690. That should make the week less about one clean opening move and more about whether price can stay inside that core inventory pocket or break outside of it.
So for the week as a whole, I would treat 6630/6660 as the center of gravity, 6679/6585 as the first real directional checkpoints, and 6727/6537 as the outer edges of the current all-week risk envelope.
Above 6690, the profile starts to thin out enough that upside can travel faster toward 6720/6727, and if that upper edge is accepted, the next meaningful overhead shelf looks more like 6780/6810.
Below 6585, the market starts slipping away from the tightest nearby inventory. That puts 6540/6537 in play quickly, and if that lower edge fails, the move can open into 6510 and then 6480, with a deeper weekly flush bringing 6420/6390 into focus.
So the week’s broad question is not just “up or down,” but whether SPX can stay pinned inside the 6600–6690 pocket or escape into a larger trend leg.
Gamma:
The all-expiry profile suggests the 6600–6690 area should behave as the main control zone. When spot is trading inside that pocket, dealer hedging is more likely to reinforce back-and-forth trade and keep the market interacting with nearby strikes. That creates a tape that can still move, but tends to stay tied to the central cluster rather than run freely.
The profile becomes more directional once price starts leaving that zone.
Above 6679/6690, the market begins to move away from the heaviest nearby inventory. That can allow upside to travel more efficiently into 6727, and if the upper weekly edge is accepted, the move can extend faster toward the next overhead shelves.
Below 6585, the same logic applies in reverse. A break of the lower half-straddle starts to pull the market away from the central strike cluster. If 6540/6537 gives way, downside can become much more fluid, with 6510 and 6480 the next natural targets.
For the week, gamma says the middle should be sticky, while the edges should move faster.
Charm:
Charm is also relevant because the board contains all of the week’s expiries.
As time passes, decay should keep pulling attention back toward the strikes with the densest nearby positioning. In this setup, that makes 6630, 6660, and 6690 especially important above spot, while 6600 and 6540 matter most below.
If SPX spends time in the mid-6600s, charm should help support a market that repeatedly re-centers around those strikes. That favors intraday reversals, failed breaks, and movement back into the core range after excursions.
Charm becomes less helpful once price establishes itself outside the half-straddle boundaries. Above 6679 or below 6585, the market is no longer sitting on top of the strongest decay magnets, so directional movement becomes easier to sustain.
That makes charm most effective when the market is already near the center, and less effective once price starts pressing the outer edges of the weekly range.
WEEKLY BIAS:
Base case: trade rotates inside 6600–6690 until one side decisively clears.
Bullish path: hold the mid-6600s, reclaim 6679, extend into 6690, then probe 6727.
Bearish path: lose 6600, break 6585, test 6540/6537, then open 6510 >> 6480.
The key read for the week is whether SPX remains tied to the mid-6600 control zone or escapes it. Inside that pocket, expect two-way trade. Outside it, expect faster expansion toward the weekly edges. (End of AI writing)
ES Risk Reversals:
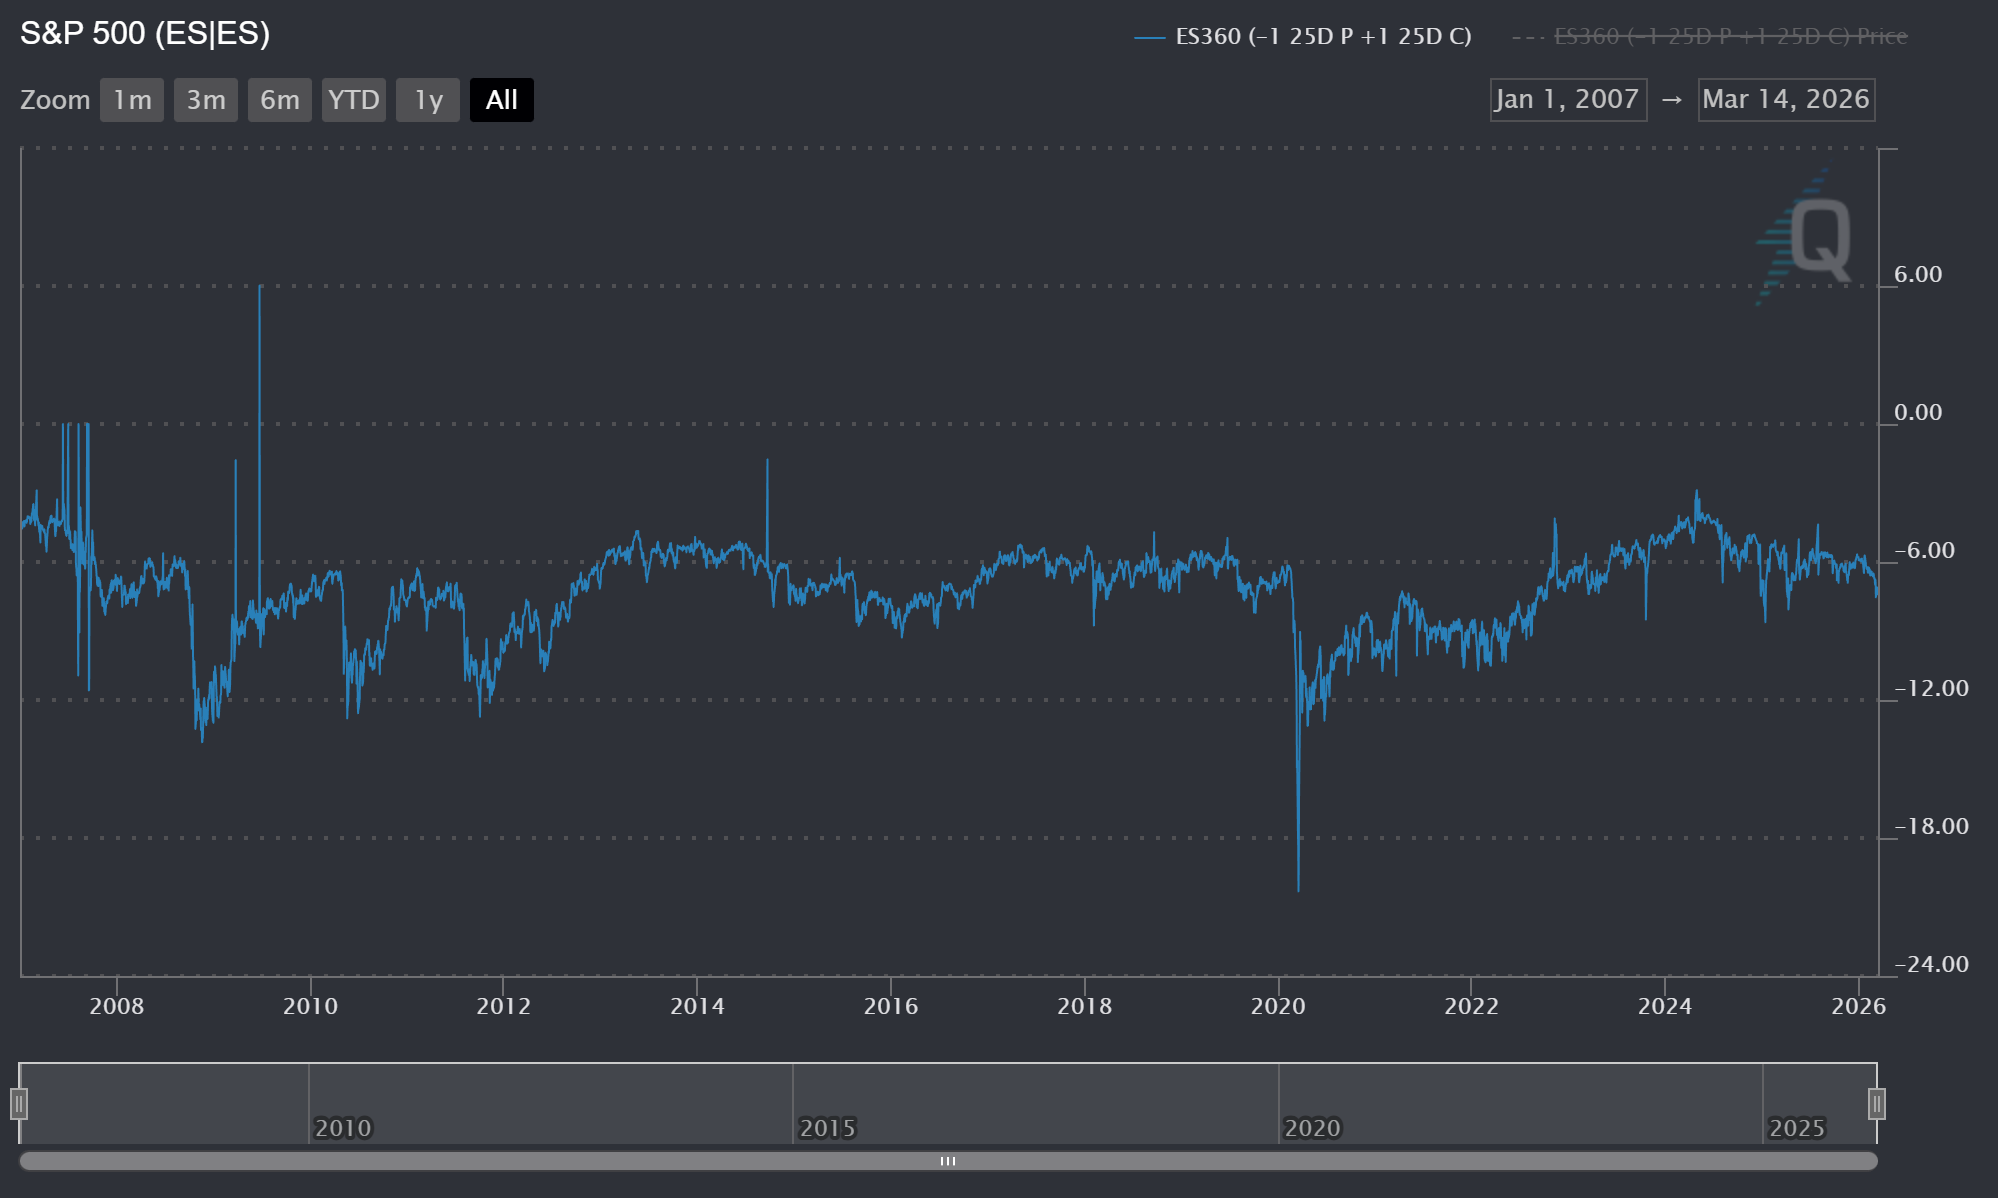
ESH6 and ESM6 25 Delta Risk Reversals (25D RR) continue pricing a greater probability of a crash down than a violent move up. The constant maturity ES Z-Scores for 25D RR vol skew shows that the longer the tenor the higher the vol on the put side of the RR. I believe this fairly normal as indexes are often used to hedge downside risk for a book long equities. Also history shows paying for insurance on a large equity book via puts on the SPX or ES has been a solid hedge. However, the constant maturity for 360 days for ES shows the put skew spiking driving the chart lower. (Figure 8) While this is certainly a sharp drawdown in comparison to the last year it is nothing compared to history. (Figure 9) It is my view that put skew will start to cool meaning OTM call vol rises faster than OTM put vol. At least on longer tenor options. Shorter term for example, the constant maturity for 30 days for ES options had a reading of -8.47 far below the lower quartile of -5.99 and mean of -5.18. (Figure 10) The LQ and mean I quoted are for the entire data set I have which goes back daily to early 2007. (Figure 10)
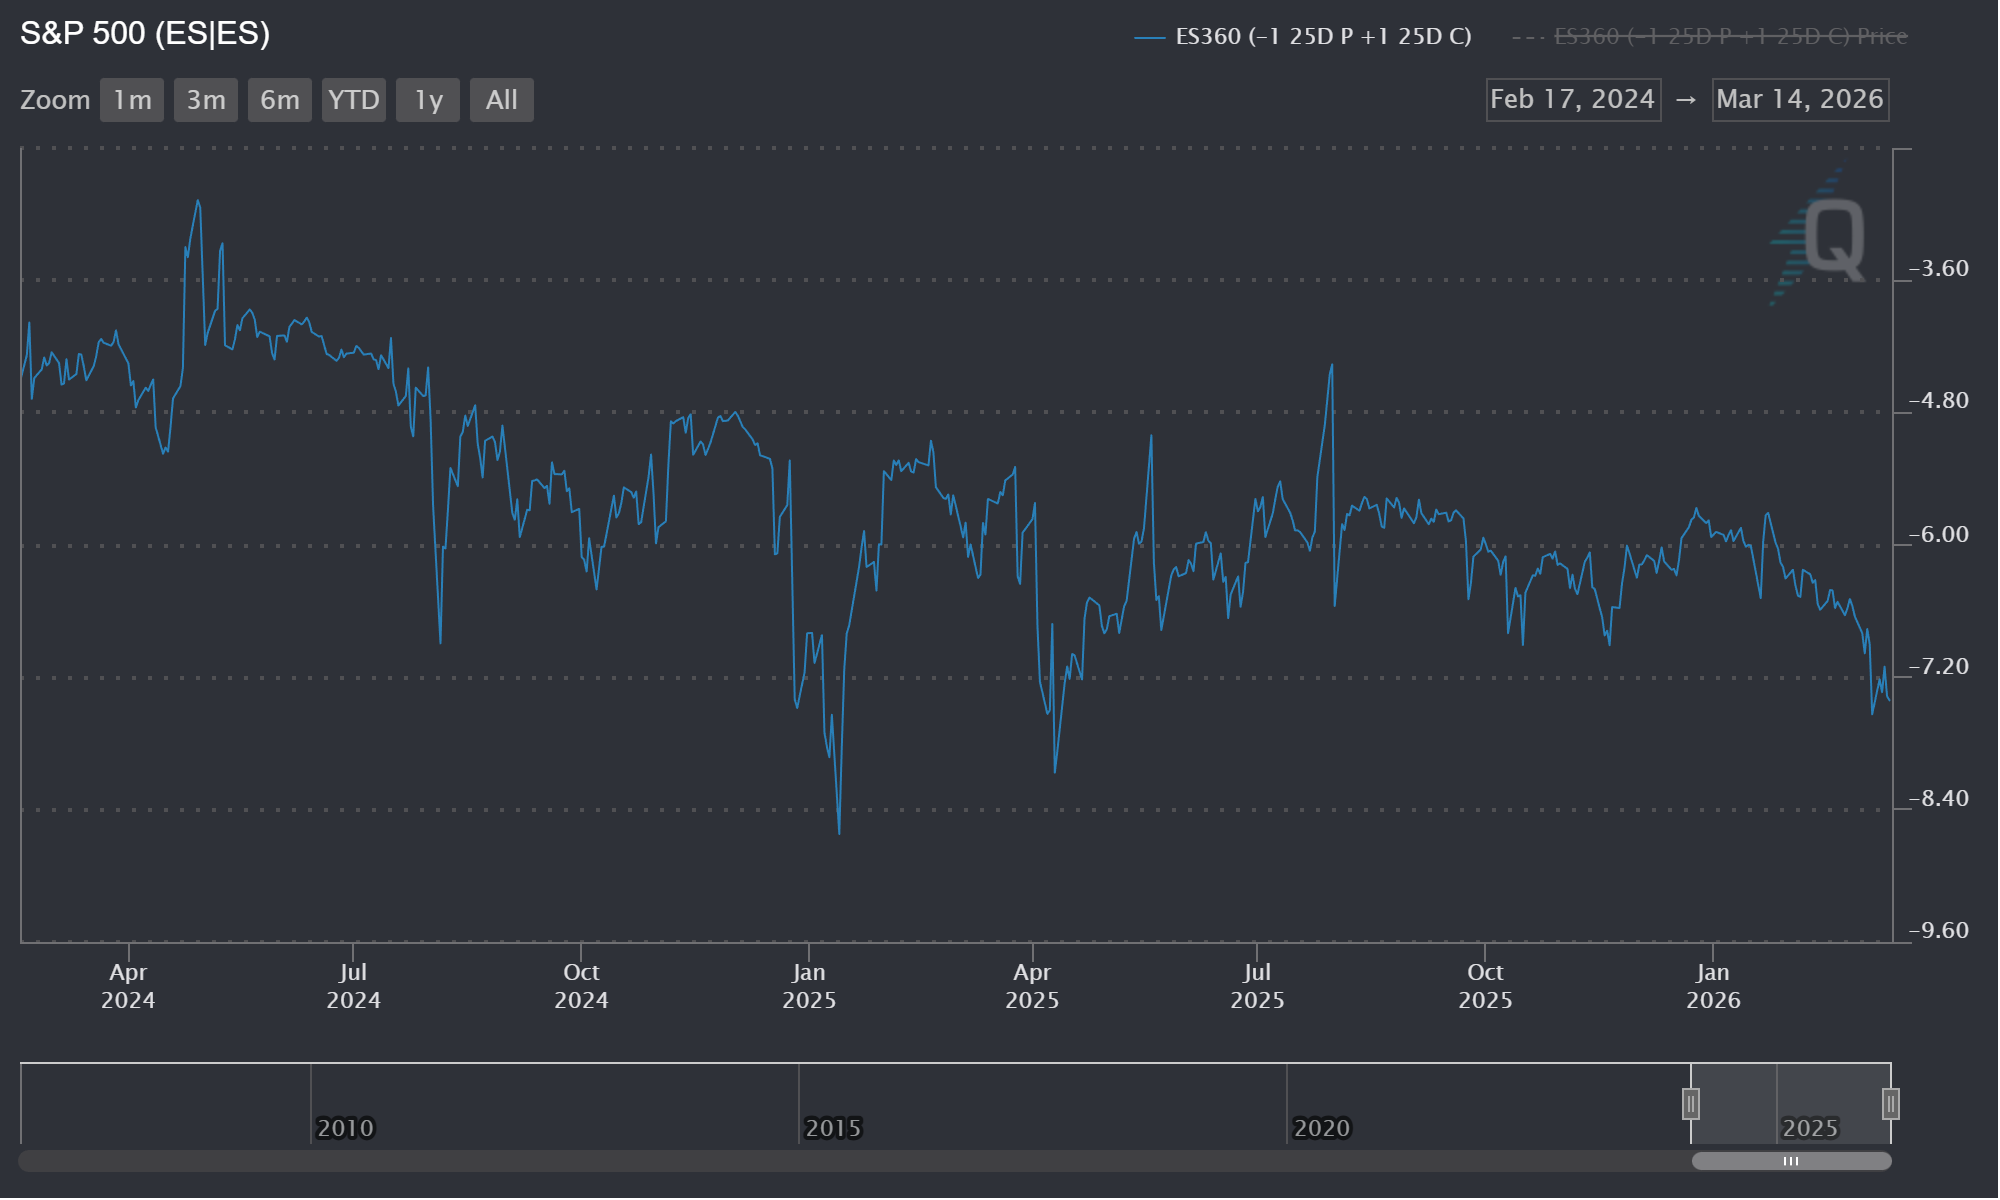
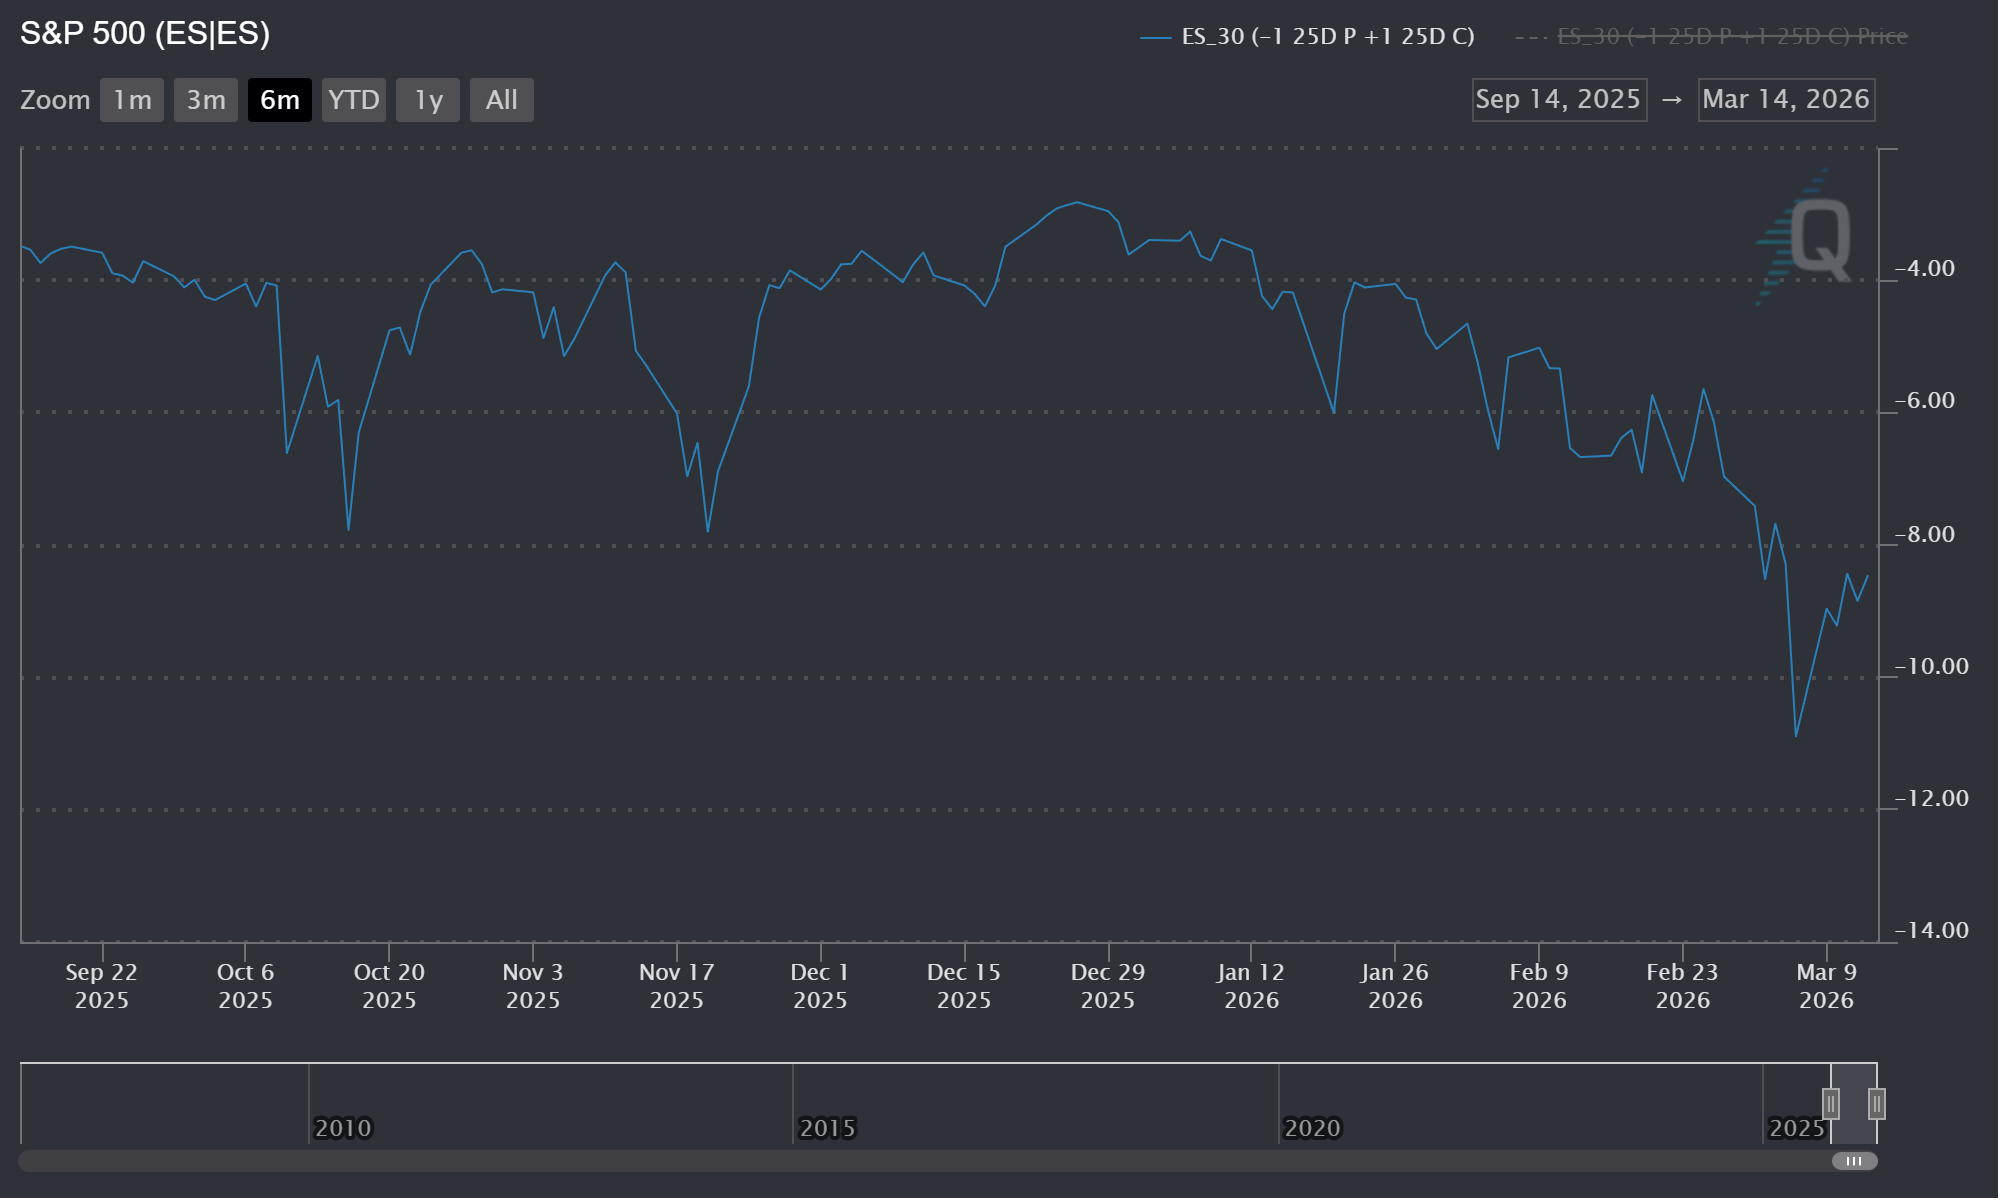
To make a very long story short watch shorter dated put vol (30 days and less) and 25D call vol. In my view the market is mispricing upside risk ASSUMING this war Iran doesn’t expand to a full invasion. If there is a full invasion than downside protection is still relatively cheap.
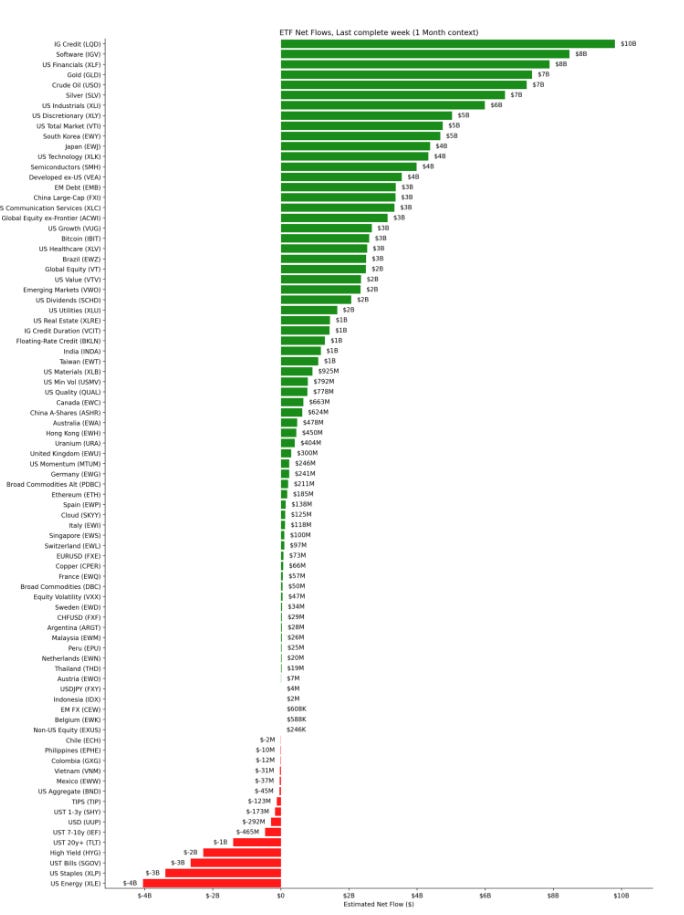
ETF Flow:
This one month ETF flow chart from is via Arya from he is awesome suite of tools you can find here! The tools on the site are honestly extremely helpful for framing equites and macro and all for free, check it out!
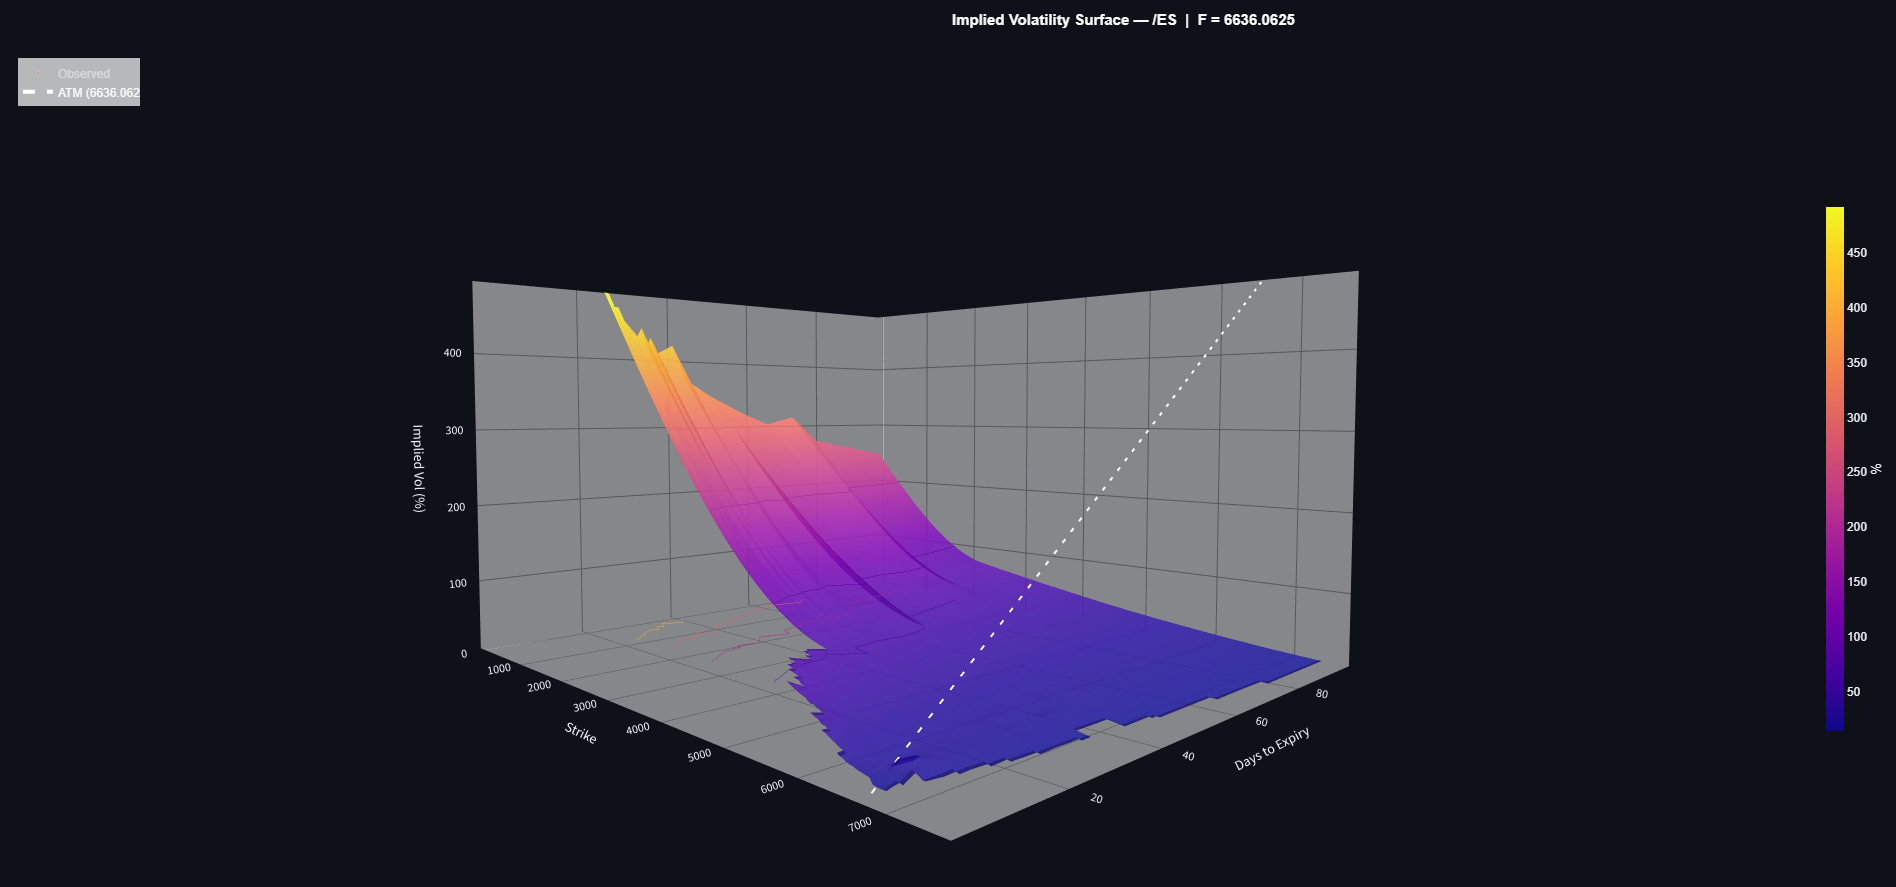
ES Vol Surface:
Below is my first attempt at coding up a vol surface. The inputs are 32 expires 2097 options definitely a small sample size but it is a proof of concept for something bigger coming sooner. If you see any glaring issues with it please leave a comment so I can get it fixed and hopefully deployed to subscribers. I mostly wanted to show this for feedback so that is always welcome in the comments!
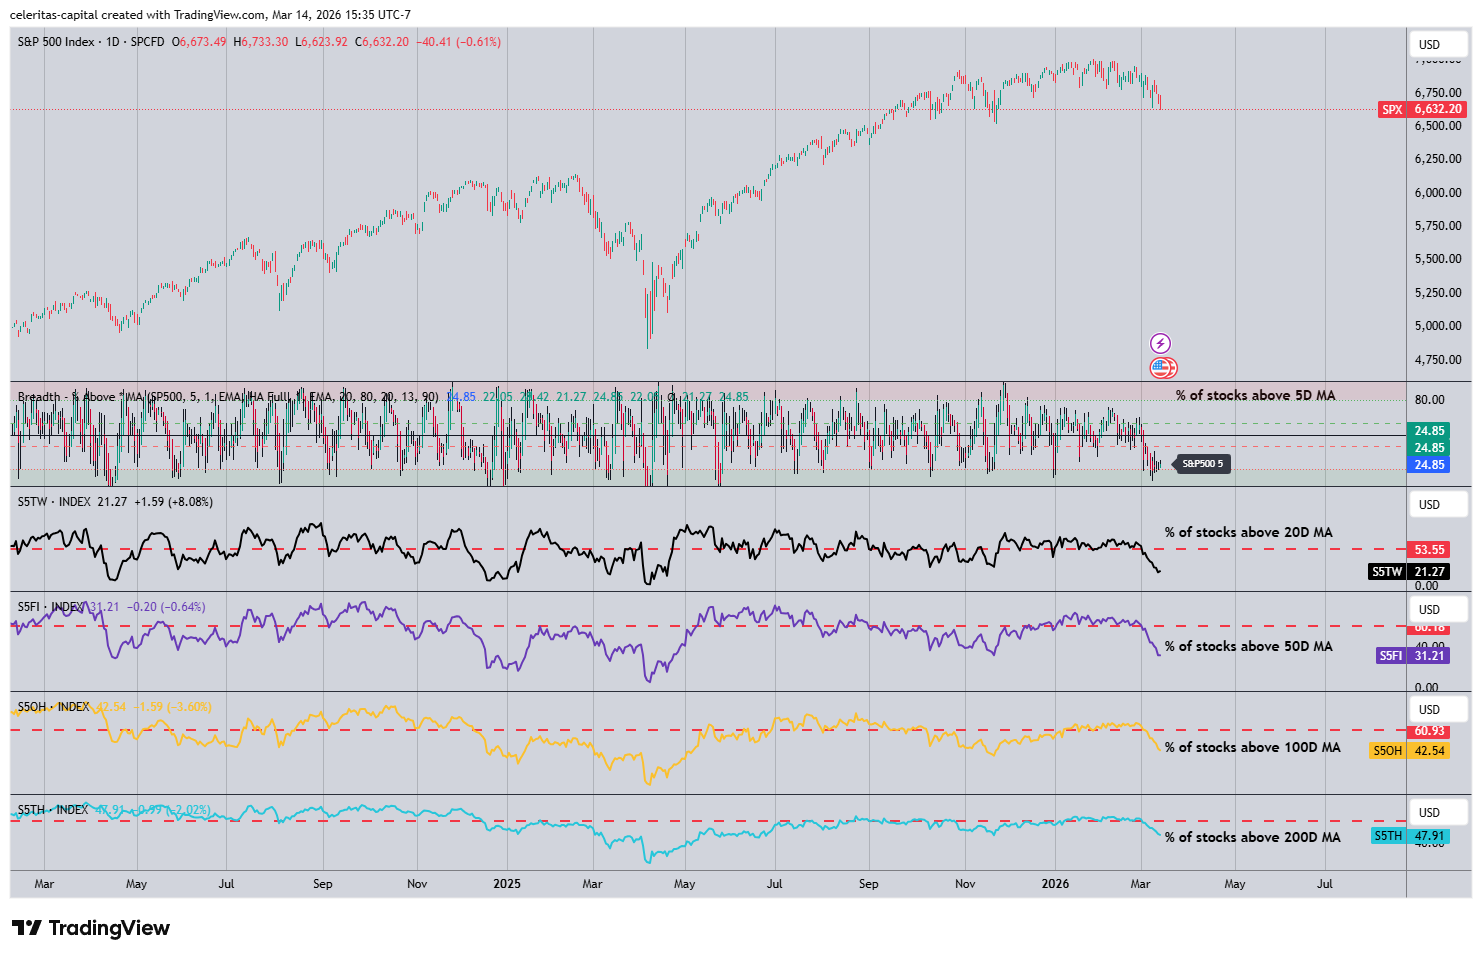
Breadth on SPX:
I am not much of a believer in breadth but strong breadth is certainly a characteric of a bull market. As you can see in Figure 13 below breadth certainly isn’t strong at the moment.
Assets I’m Watching This Week:
Finally lets end with what assets I will be watching this week. Of course the classics are on the menu like ES, NKD, whole SOFR curve as well as bond futures. Two equity names I will be watching PLTR 0.00%↑ & OWL 0.00%↑ both of which have been in the news recently but my eye was caught by something else. Using QuikOptions (following the link should let sign up for a free account that offers a ton of stuff. The monthly or yearly subscription is even more powerful and how I can view and analyze these spreads). The PLTR 0.00%↑ trade that caught my eye was this put calendar spread. This was a Floor Trade, if you want my opinion it is likely a vol trade. (Figure 14) It could be long the longer dated tenor and short near term vol but of course I don’t know but I will be watching PLTR 0.00%↑ using QuikOptions.
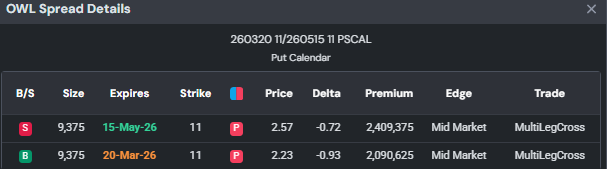
As for OWL 0.00%↑ this Put Calendar Spread with this trade collecting over 300,000 in credit. (Figure 15) This seems like a risky trade to put on since it is a short Calendar, again I think this is someone probably a lot smarter than me trading vol but who knows? I will be watching OWL 0.00%↑ for a meme like activity as well which should spike the price on muted or no news.
That is all I have for this weeks post, I hope to come back on touch the logic for my 3-Month EURIBOR Futures call spread trade. New posts will keep coming, in a few days I will start sharing my models with subscribers first will be my STIR indicators. All code is open source of course but more on that later. Check out my last post on the long greens trade (SR3Z28) Thank you for reading everyone the Celeritas will keep improving.
Reading the Greens: Convexity in Long SR3Z28

Hello everyone welcome back to Celeritas Capital today I am proposing a high conviction trade on SOFR futures. Specifically, SR3Z2028. This post is best read on Substack using the Website or App which I prefer personally. Regardless let’s dive in you will find the sections of this post below so you can save time and read what is important to you.