


Market Malarkey 4/2-4/7
Weekly Market Updates & More

*Hello and welcome back to Celeritas Capital! First we would like to thank our readers, even if you just skim our report it means a lot as we put a lot work into our articles. Second this week’s Market Malarkey will be shorter than normal due to the removal of the Macro overview section and we working on several other articles. Do not worry the Macro overview section will be replaced by a longer form monthly Macroeconomics report.*
Rundown from last week (3/26-3/31):
Last week’s trading period was certainly an interesting one. The start of the week the market was range bound but that all changed on the 29th with a large gap up on SPX. (Figure 1) With the rest of the week seeing US equities rallying near YTD highs. (Figure 1) It is our view this rally was fueled by shorts closing their positions as well as CTAs positionings bullishly midweek. (More on CTA positioning in the preview for this week section)
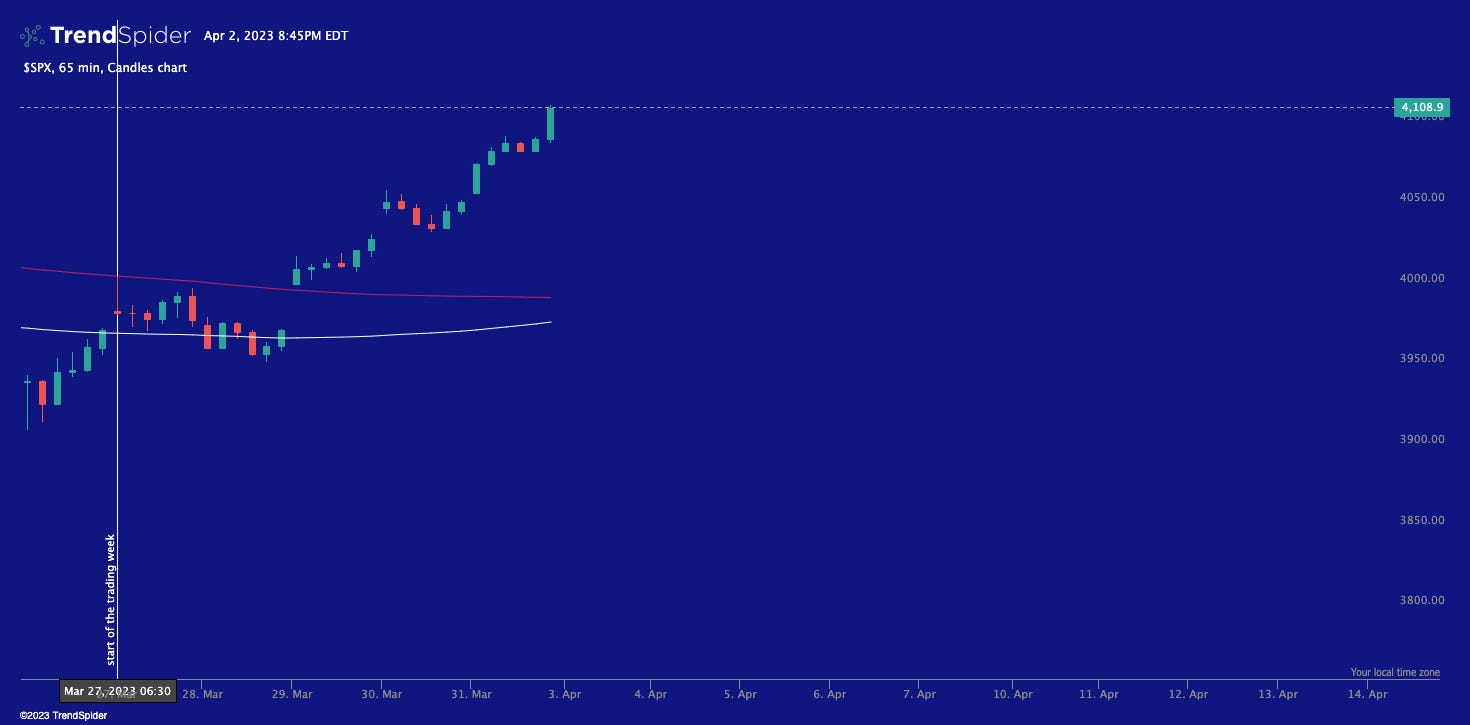
As for the rest of the US equity market indexes they also saw a serious rally in price with SPX leading the rally followed closely by RUT & DJI. (Figure 2) The US Treasuries (USTs) yields across the major indexes traded choppy throughout the week with the longer term USTs (TNX & TYX) both ending the week in the red. (Figure 2) However the shorter dated UST index FVX (5Y UST yield) end the week up a little more than 1%. (Figure 2) Finally the VIX ended the down more than 12%, we would like to point out that the VIX is a little more than $2 above it’s 52W low.

Preview for this week:
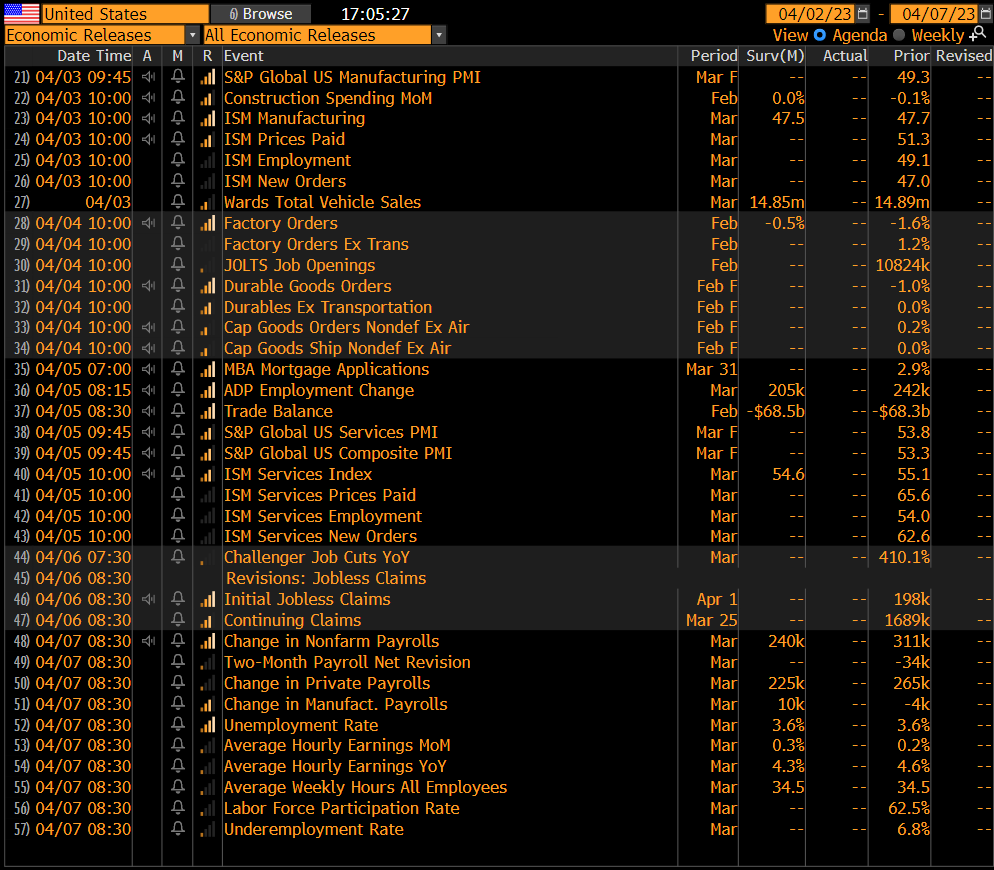
We expect this week to be a volatile one just like the previous one for some of the same reasons but also a few more market obstacle. First we will start with why we think this week will be different. First, as shown in Figure 3 there is a large amount of different labor data points being released. With the largest day this week with Economic release being Friday the 7th, followed closely by Wednesday. (Figure 3) It is still our view the labor market in the US will continue to cool.
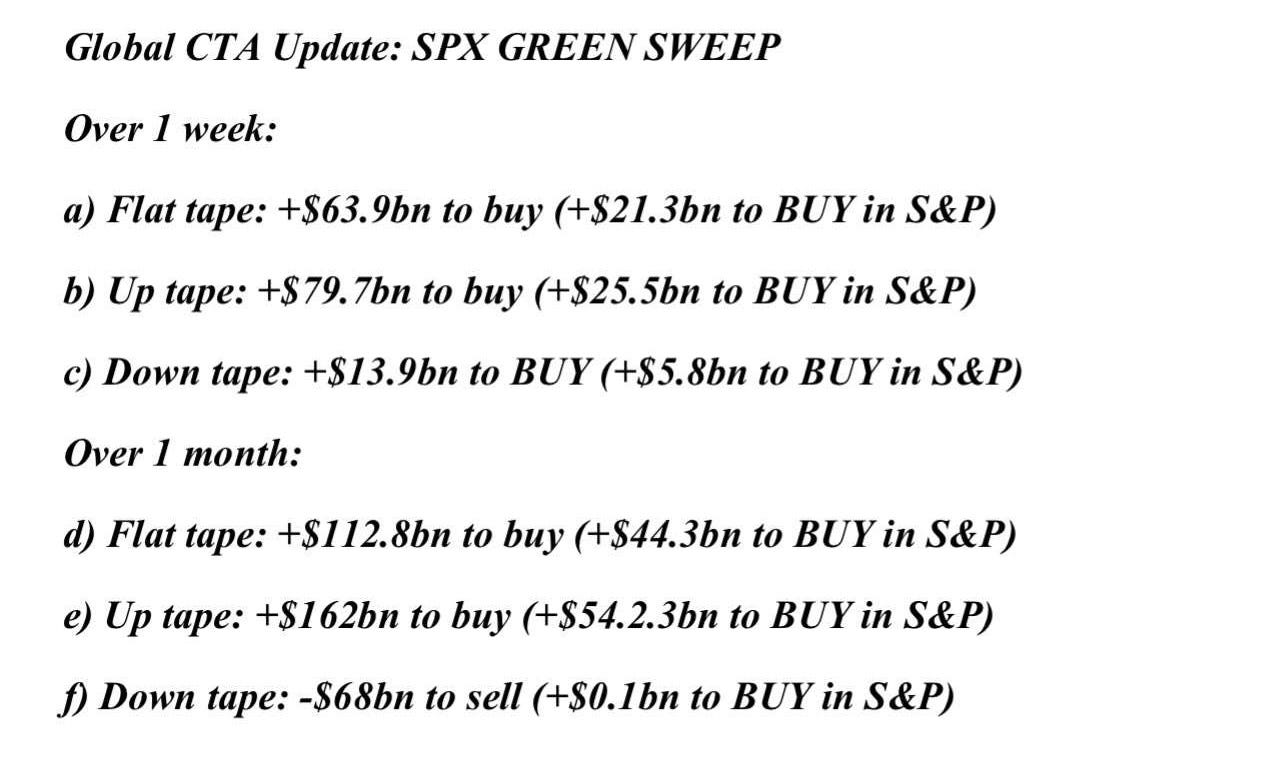
However, our second point was alluded to in the previous section, CTAs. If you are not sure what a CTA is do not worry it is an extremely complex idea. However, in short CTAs are a type of trading strategy that has access to large amounts of capital. (To learn more on CTAs and the role they play in the market click here to read a great paper from CME Group) In-fact according to Goldman Sachs CTAs are positioned to buy up to $79.7 billion in US equities in the coming week in an up-tape market. (Figure 4) We believe this added buying will result in a bullish week for US equities this week.
We would be doing our readers a disservice not mentioning the OPEC oil cut that was announced Sunday April 2nd. (Associated Press) This caused Crude Oil Futures(/CL) to gain over 6% verus the closing price on Friday. Oil related stocks are likely to also rally with /CL prices. More on this in the possible trade section. CTAs are also short /CL so that fact could add even more fuel to the Crude rally.
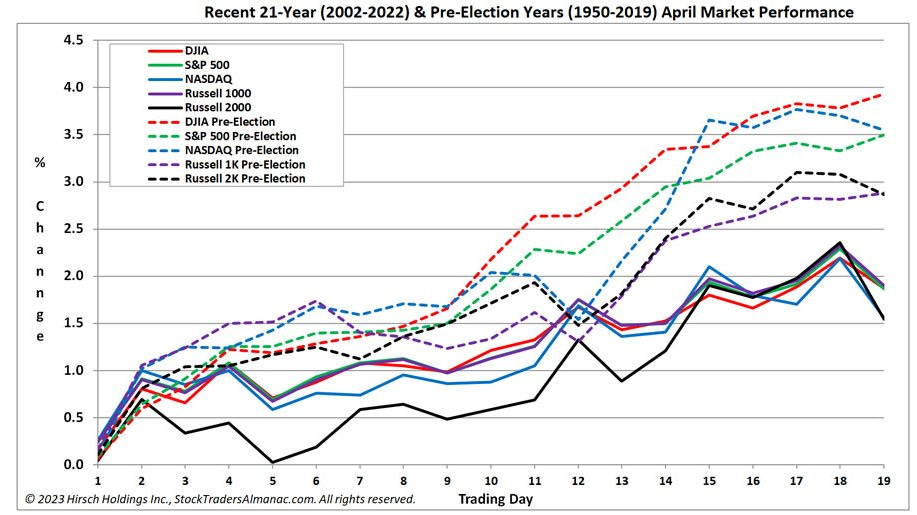
Next we would like to point to the fact that historically April has a been a very bullish month for the US equity markets. (Figure 4)

This is even more true during years that precede a US election years as shown in Figure 5. Now as everyone knows past performance is not an indication of the future. However, with the CTA positioning along with seasonality could lead to a rally during the month of April.
Earnings this week are very lackluster.
US Treasuries & Fixed-Income:
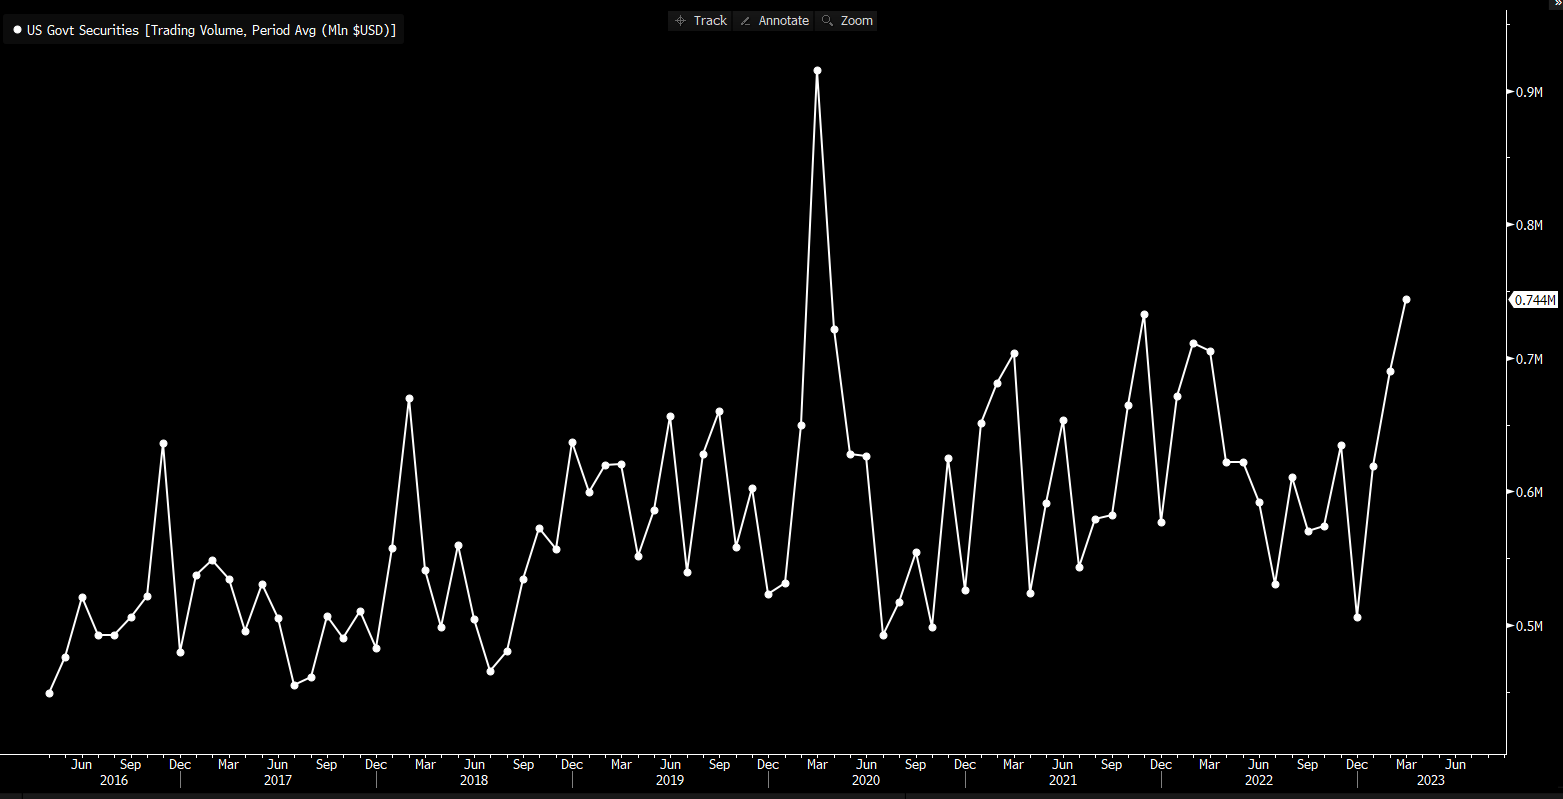
First we would like to mention that UST liquidity was up near 2021 levels. (Figure 6)
The 2Y UST yield continues to trade extremely volatile intraday, this makes it extremely hard to use TA for it. (Figure 7) That being said we expect the 2 UST yield to trade with in the range of the triangle (yellow trendlines) unless it breaks and holds below the 200d SMA. (red line) This is our bear case for the 2Y UST, the bull case in our view is a break and holds above the 200d WMA. (white line)

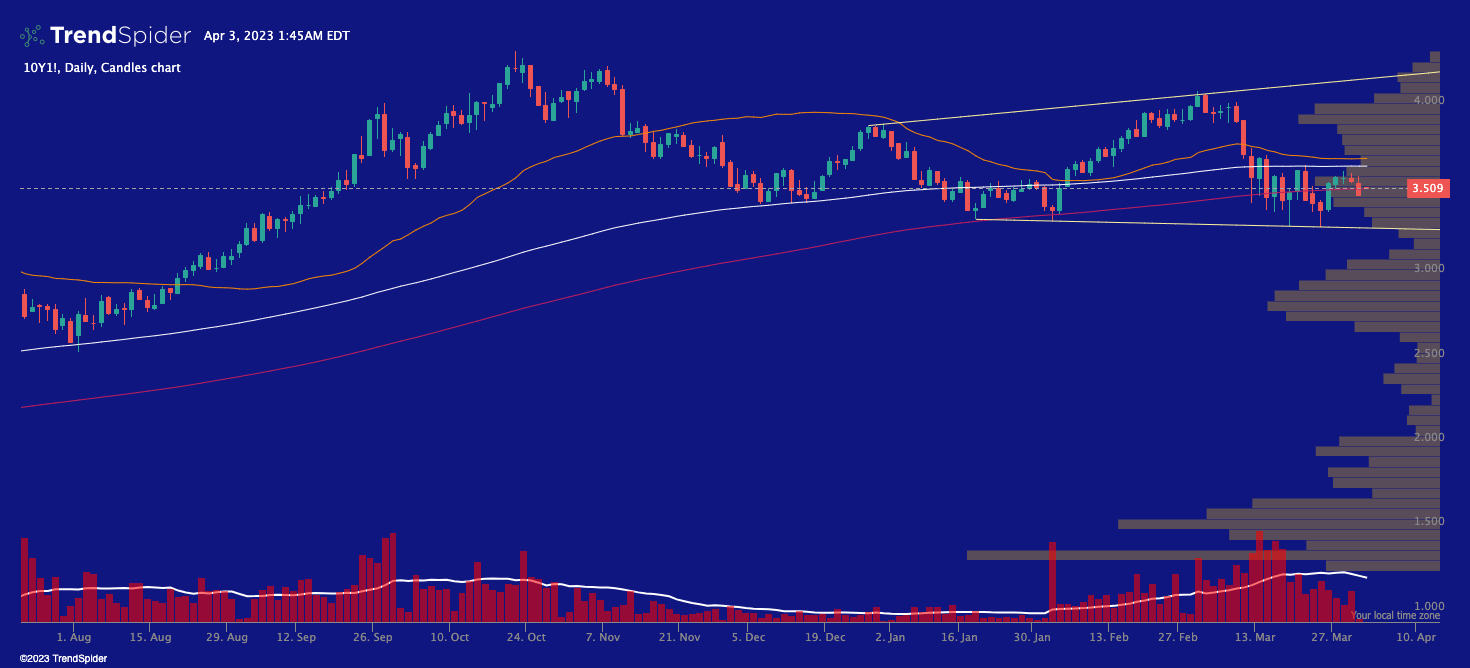
10Y UST yields are still trading range bound, likely due to the fact investors would rather hold shorter term and higher yield USTs. Our bear case for the 10Y UST yield is a break and hold below the 200d SMA (red line) if this plays out we see the 10Y UST yield dropping and testing the bottom yellow trendline. (Figure 8) The bull case in our view is a break and hold above the 200d WMA (white line) but we believe this is very unlikely. (Figure 8) The 10Y UST is likely to trade range bound again this week in our opinion.
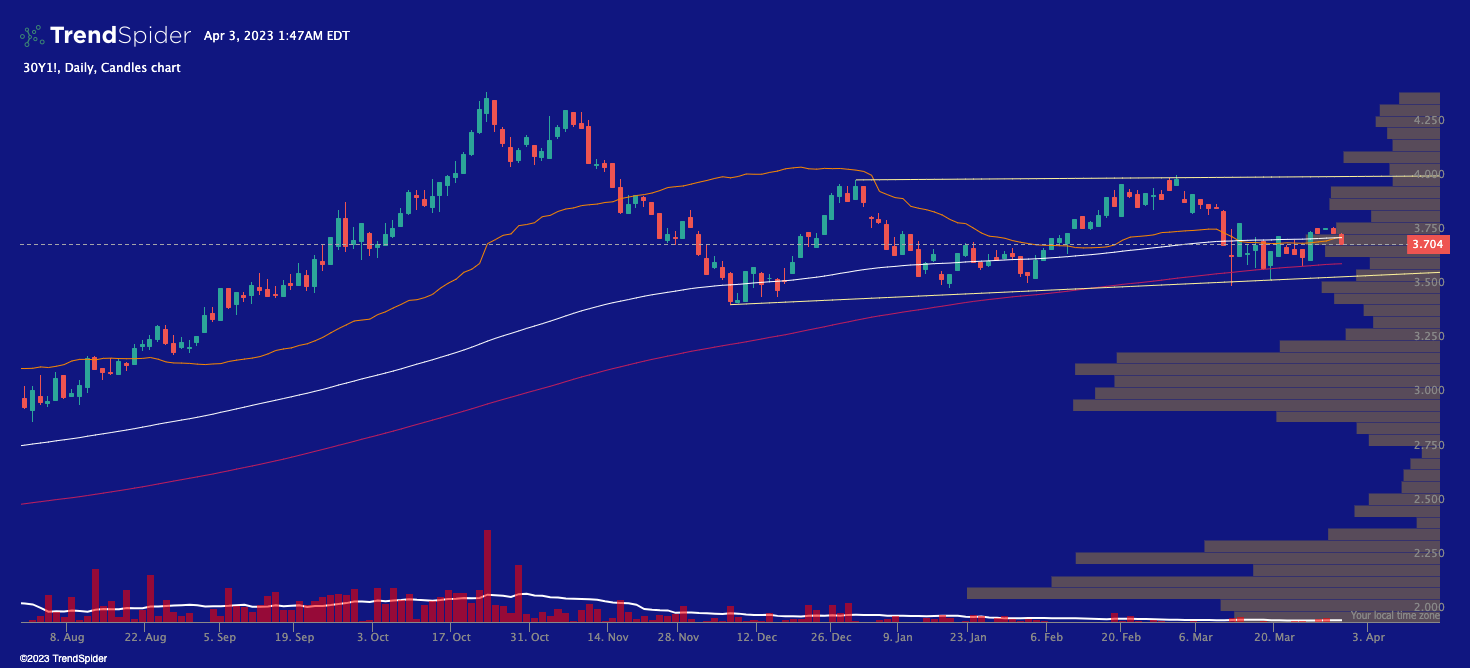
Last we have the 30Y UST yield shown in Figure 9. Like the 10Y UST yield the 30Y UST yield has been trading range bound. We expect this to continue into this trading week as well.
Corporate Bonds:
No corporate bond write this week. Our apologies!
Possible Trades & Follow ups:
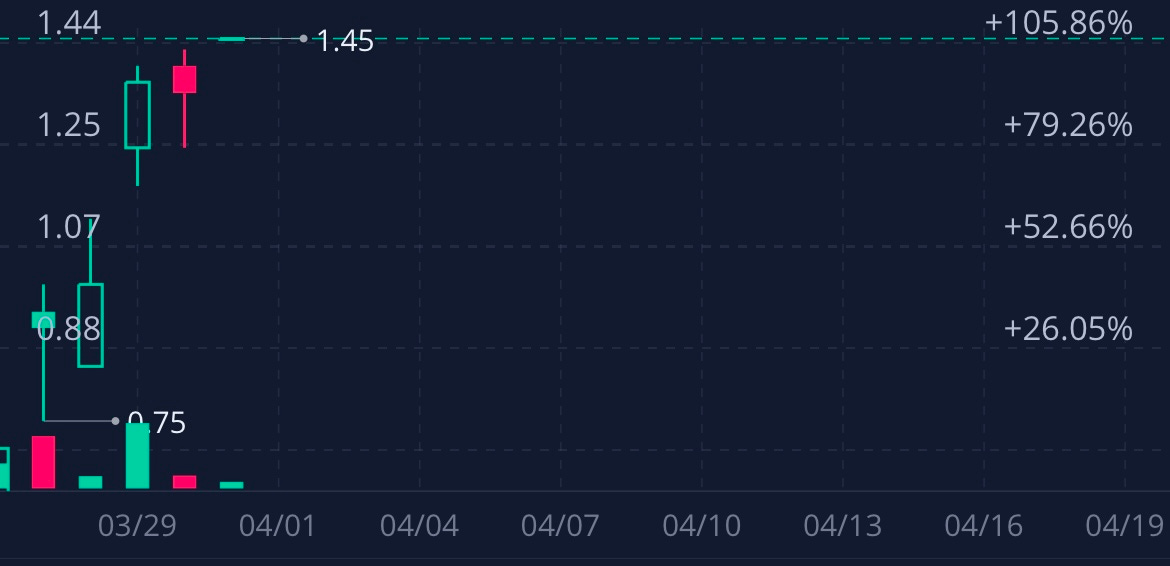
To quickly review our possible trades from last week we will quote last week’s Market Malarkey. As well as review them the bullish lean on US equities was a winner. However, the real winner from our possible trades is the SVIX $16c expiring April 23rd. As can be seen in Figure 7 the minimum gain if you bought the contract on Monday the 27th of March and a maximum gain of over 100%! We must admit possible short trade of the Canadian Dollar went the opposite way we expected.
“As for possible trades for this week and beyond we are bullish on US equities in the short term. This trade can obviously be put on in an endless amount of ways but tech has been rallying. The next possible trade setup we like is SVIX calls, with equities rallying VIX is likely to keep dropping. We like the strike of $16 with the expiration of April 23rd.”
As for this week possible trade setups we like this week, as mentioned earlier with the OPEC oil cut /CL is likely to keep rallying. Along with oil stocks, among the many names in the industry we believe the stocks that are likely to outperform the sector. Include XOM, DVN & OXY. We are still bullish on US equities as a whole.
That is all for now, thank you for reading! Any feedback positive or negative is greatly appreciated!
DISCLAIMER: We are not Financial Advisors, and all information presented is for educational purposes ONLY. Financial markets can be extremely volatile, as such using good risk management is a must.