


Market Malarkey 3/26-3/31
Weekly Market Updates & More

Rundown from last week (3/19-3/24):
This past trading week was very choppy for both US equities and rates, but even with the FED raising 25 BPS the equity market still ended the week in the green. (Figure 1) With the NASDAQ led the charge ending the trading week up 1.80%, followed by the S&P and DOW Jones up 1.37% and 1.15% respectively. With the RUT (small cap stocks) struggling only up a modest 0.08%. (Figure 1) The three major US Treasury yields (USTs) were a mixed bag last trading week, with the 5Y (FVX) & 10Y (TNX) yields both ending the week slightly in the red. However, the 30Y UST yield (TYX) ended the week up 47 BPS. The VIX again had a “bad” week however it is important to remember the VIX is simply an index that measures expected volatility for the S&P 500.

As we are sure you are aware the threat of a banking crisis was one of the main talking points of many traders this past week. With some analysts even calling for a pause in rate hikes or cuts due to the perceived banking crisis, luckily the FED did what needed to be done. It is our view that reducing inflation is a much more pressing issue that can lead to much bigger issues if left alone. (More on this in the Marco overview section.)
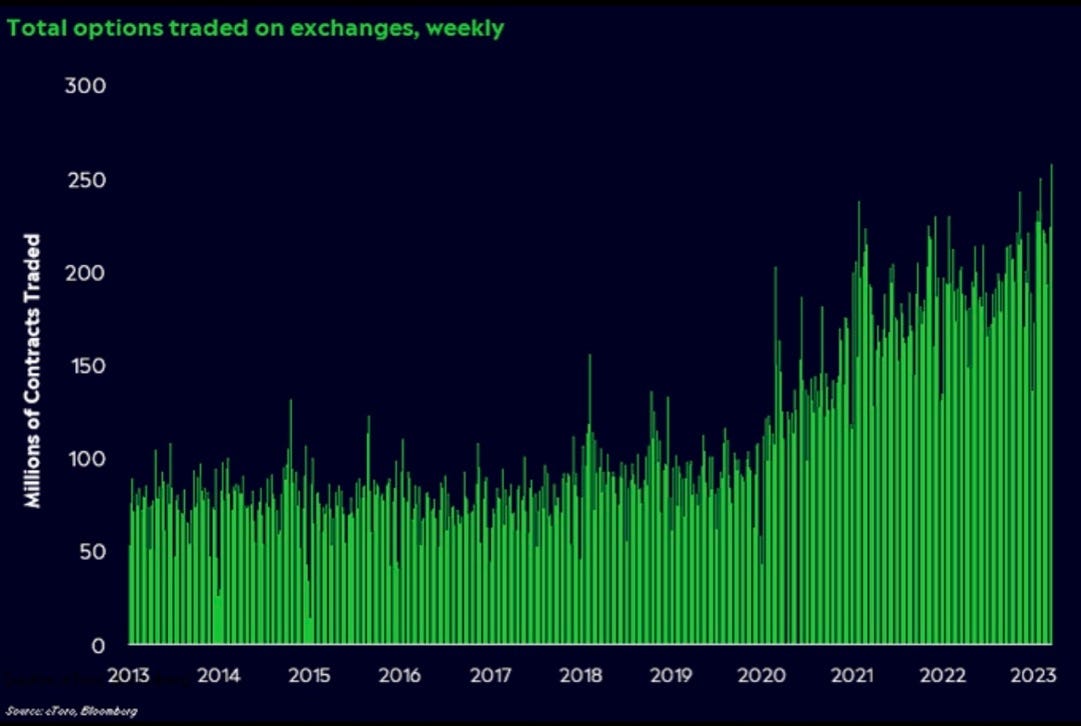
Finally, we would like to highlight the record number of options that have been traded in the past couple of weeks. (Figure 2) In our view, this tells us that traders most likely institutions are likely hedging for something. (Figure 2) What they are hedging for we can only speculate. However, with a recession on the horizon, it is our view these options are likely hedging for a downside.
Preview for this week:
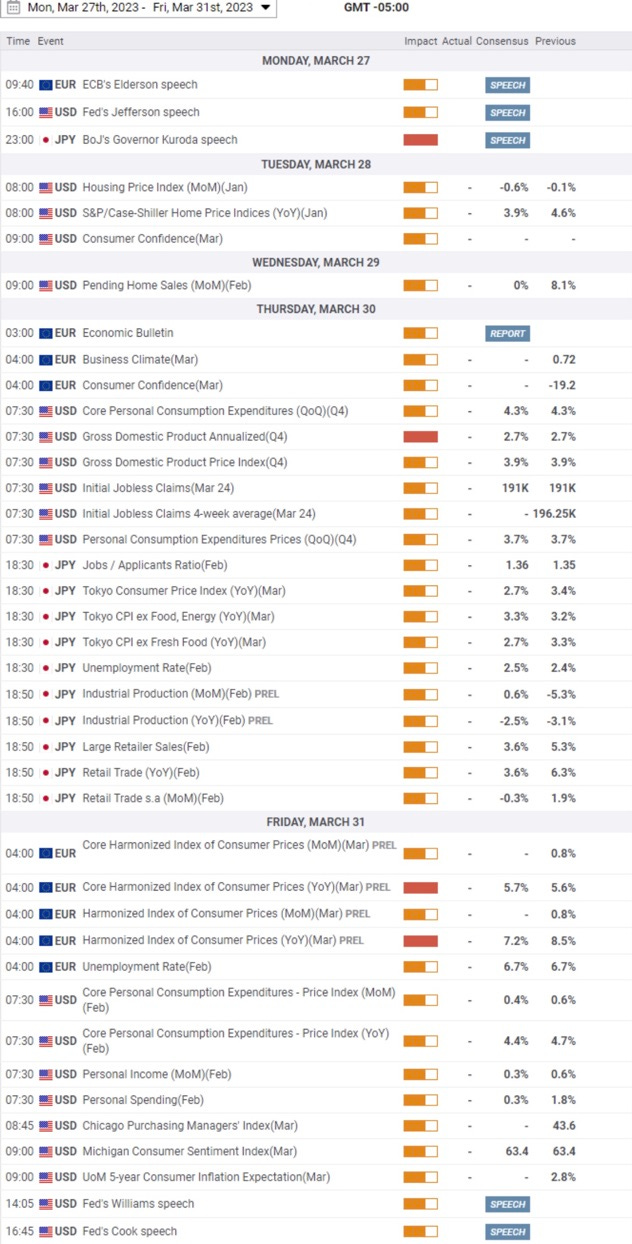
This upcoming trading week is likely to be choppy due to the lack of a real catalyst via economic announcements or other events. As seen in Figure 2 besides Thursday the 30th which includes the Q4 GDP, and jobless claims among other important economic data. (Figure 3) The rest of the week has a lot of Central Bank speakers throughout the week which could move the market, but this is very dependent on what the CB speakers say. (Figure 3)
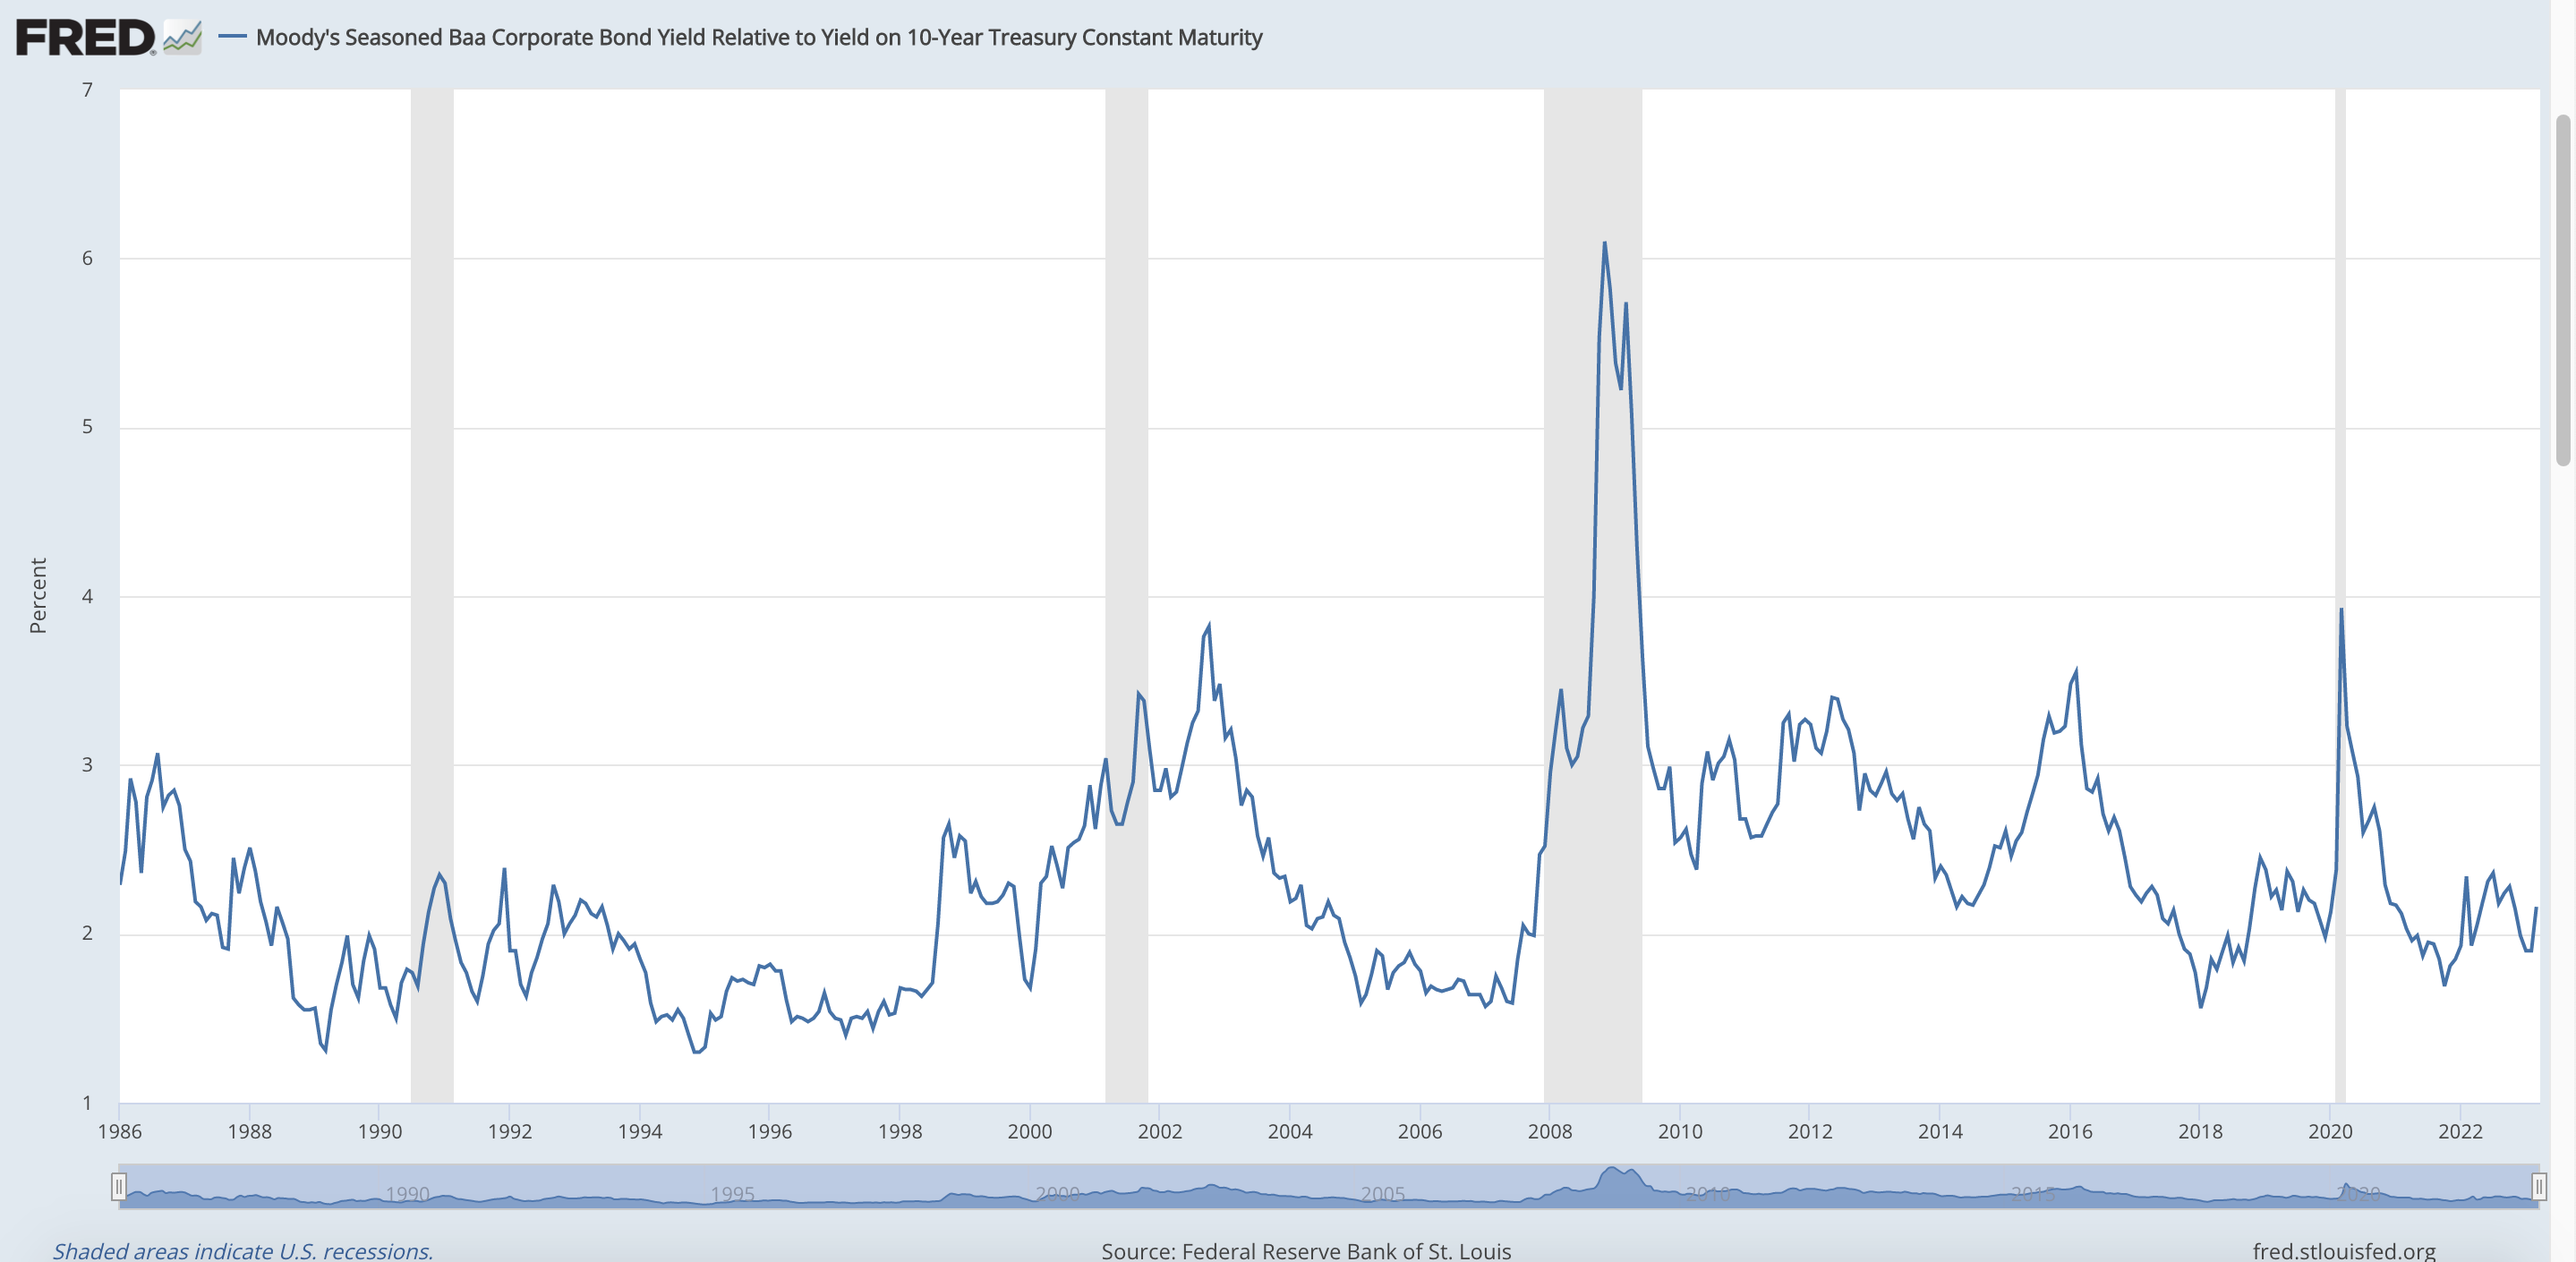
As we mentioned in last week’s ‘Market Malarkey’ we were keeping an eye out on certain credit indexes and this has not changed for this week. We did realize all of our readers might not be familiar with the importance of credit not just to the fixed-income markets but also to the equity markets. First, we will explain the importance of Figure 4, this figure shows Baa Corporate bond yields relative to the 10Y UST yield. Historically a percentage above 2.50% is a sign the credit market is at risk. (Figure 4) Currently, the percentage is at 2.16%, we believe this is due to the financial stress on banks, particularly regional banks. While this credit risk indicator does not always a leading indicator for recessions i.e. 2010-2016 it can be seen in the 1980s, the dot com bubble, and the GFC. These recessions all had evaluated credit risks as a forward-looking indicator. (Figure 4)
The other credit spread indicator is the credit spread index from Creditspreadalert.com which is a great tool. As shown in Figure 5 the credit spread index is nearing July 2022 levels. (Figure 5) As Mark Twain said “History never repeats itself, but it does often rhyme” with that being said we expect the S&P 500 to drop near the July bottom. (Figure 5)

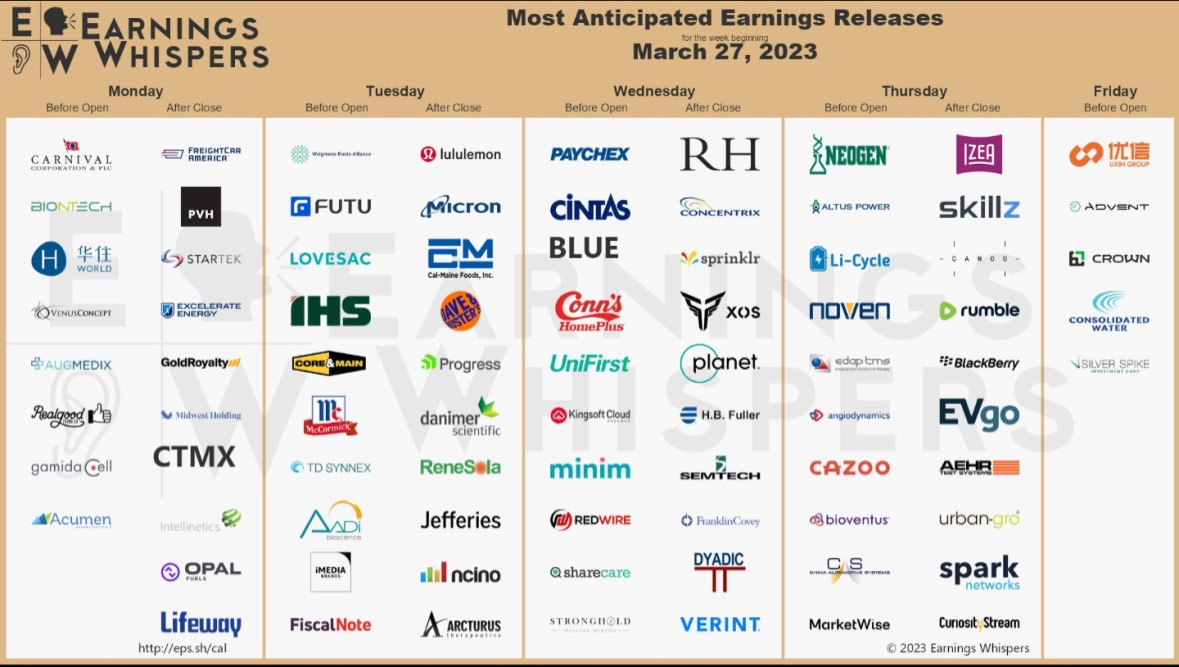
Another week more earnings reports (ERs). We at Celeritas are not particularly interested in this week’s ERs.
US Treasuries & Fixed-Income:
Again this week the focus on the UST yields TA will be a smaller part of this section. With Corporate bonds also being examined among other fixed-income topics.
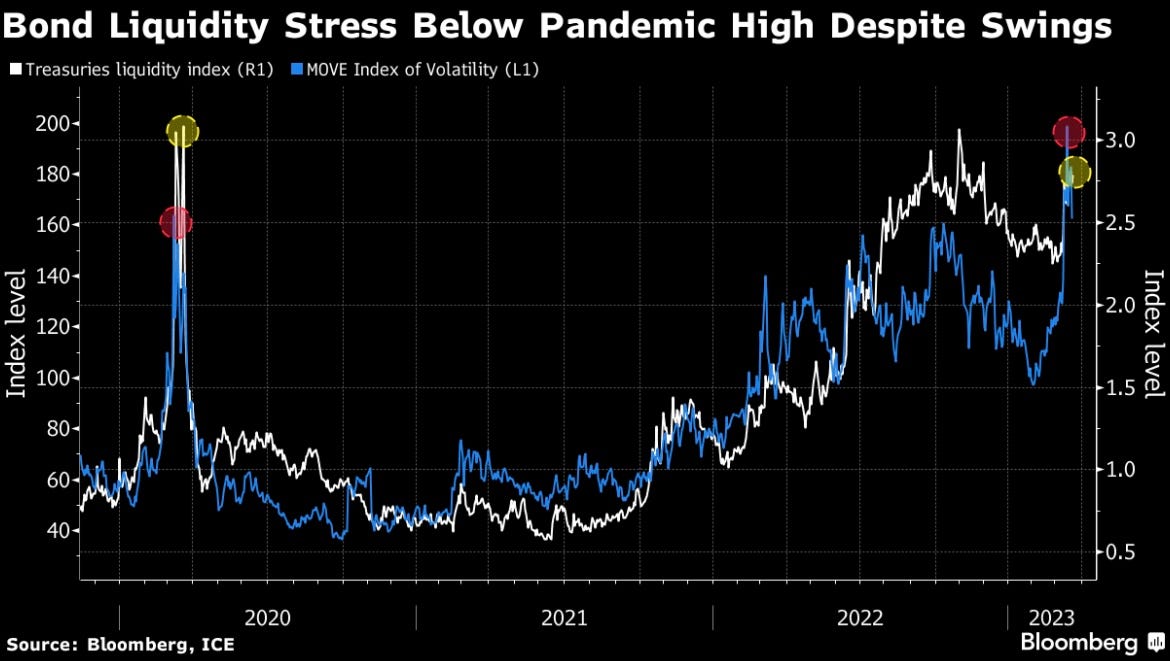
However, first, we will take a peek at the UST and the low liquidity problem with USTs. (Figure 7) It is our view that this lack of liquidity is due to banks not having extra cash to buy USTs. It is also our view that this liquidity problem will be solved when the recession officially hits, USTs have been a historically safe haven during recessions. Along with the average investor buying USTs during a recessions other CBs are very likely to buy USTs.
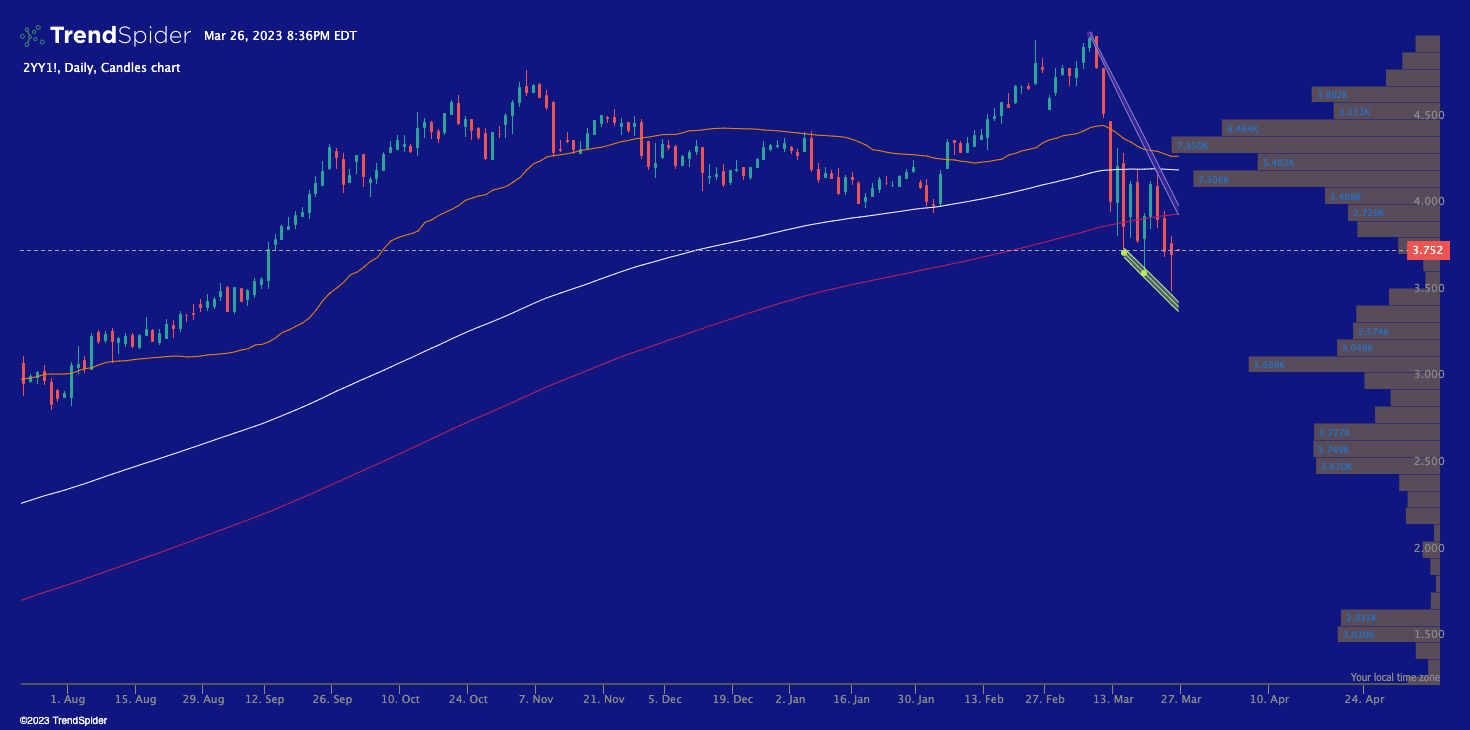
As we thought the 2Y yield re-tested the 4% area and was rejected. (Figure 8) For this trading week, we will be watching to make sure the 2Y can hold above the yellow fractal trendline. We see resistance around 3.85%. (Figure 8)

The 10Y yield has been falling ever since it failed to break and hold above 4.0%. (Figure 9) Again the yellow fractal trendline is the key support for this trading week. We expect the 10Y to fall at least 50 BPS during the start of the week and then likely trade sideways. (Figure 9)
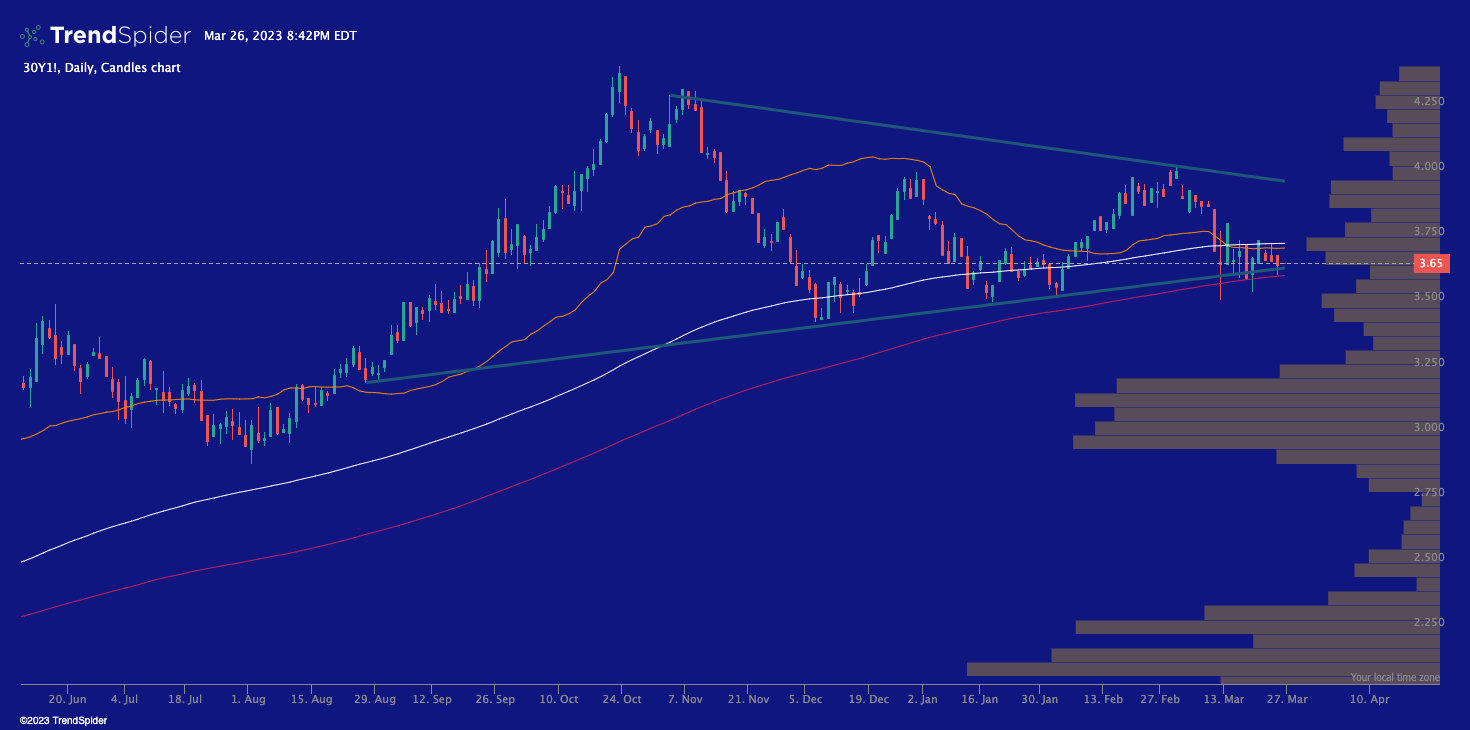
Finally, for USTs TA we have the 30Y yield. (Figure 10) The 30Y is in a very interesting spot from a TA perspective, it is key that the yield does not close below the 200d SMA which is the red line in Figure 10. If the 30Y does close below the 200d SMA we see possible downside risk. On the flip side, if the 30Y can test and close above the 200d WMA (the white line in Figure 10) we believe this would strengthen the 30Y and have the yield test the 3.8% area. (Figure 10)
Corporate bonds:
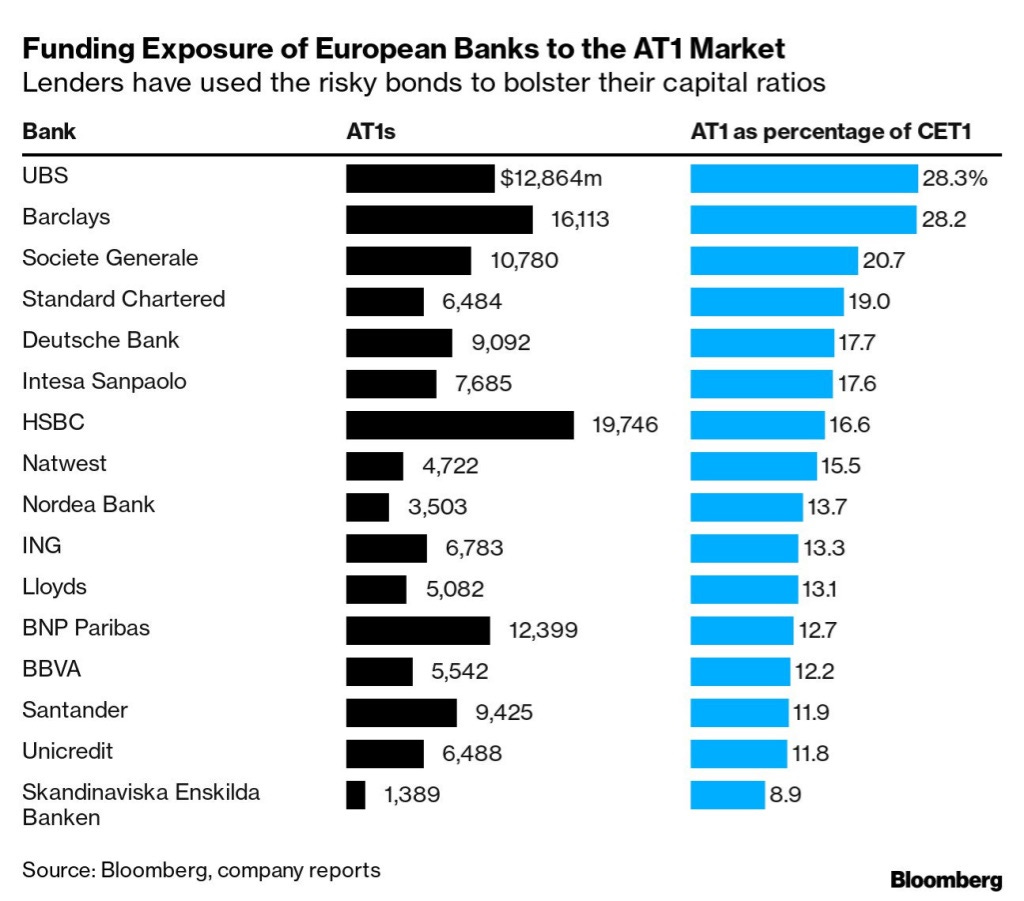
AT1s are a relatively small market of convertible bonds that were created after the GFC by European banks to create a buffer between their equity and senior bonds. These AT1s have recently been making the rounds in the news due to Credit Suisse (CS) writing these bonds off. (We also covered this in last week’s Market Malarkey) The AT1 market has been in turmoil due to the CS write-off. The reason we bring this up is to highlight that CS is not the only European bank that uses these AT1s to a large degree, as shown in Figure 11. It is our view that these AT1s will cause more problems for large European banks, especially for banks like UBS and Barclays. (Figure 11) For this reason, we believe it is more likely that a large European bank failure or possible bailout is more likely than a large US bank going under. (That being said some regional banks in the US are in precarious places, more on that later this week)
Finally, we would like to quickly touch on some US regional bank bonds. First, we like to look back at a quote and Figure from last week. Important note Figure 13 in this quote is Figure 12 in this week’s newsletter.
Next up for corporate bonds we would like to highlight that many regional banks are gearing up to issue more debt this year than any other since 2015. (Figure 13) With two of the banks already issuing more bail-in bonds this year than their yearly average from 2023-2015 would project for the entire year. (Figure 13) These are USB & PNC with an average yearly bail-in bonds being 2,730 & 1,775 respectively. That means both PNC and USB have issued around 900 more bail-in bonds then they normally would in a year. (Figure 13)
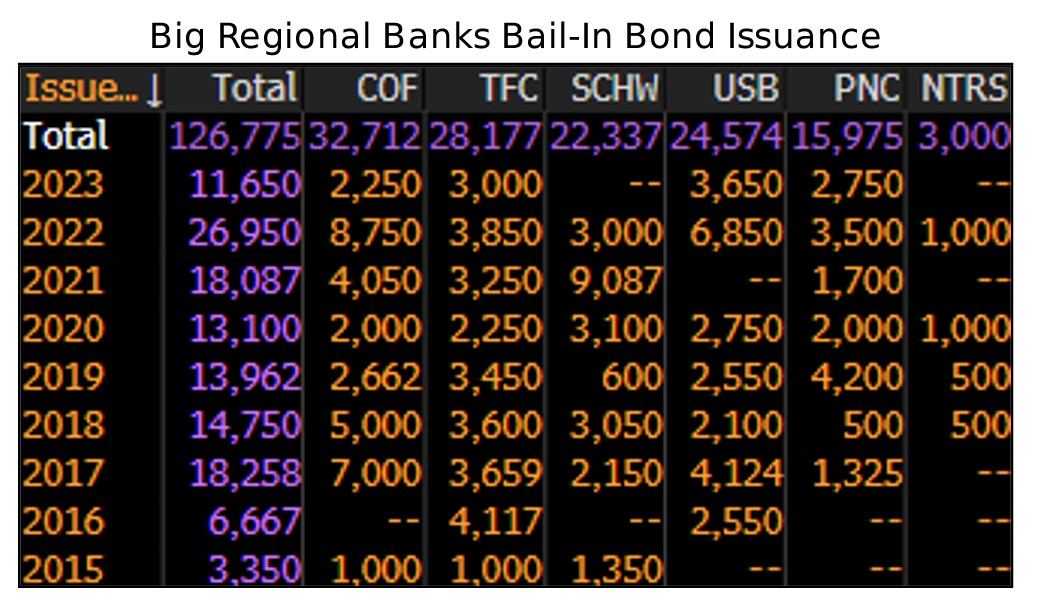
With the large amount of bail-in bonds issued by USB and PNC this year in connection with Figure 13, things are not looking great for either firm.
Possible Trades & Follow ups:
We are still shorting certain US regional banks, as mentioned earlier we plan on writing a separate piece with much more detail soon. However, this week will likely not be a great time to enter this trade.
As for possible trades for this week and beyond we are bullish on US equities in the short term. This trade can obviously be put on in an endless amount of ways but tech has been rallying. The next possible trade setup we like is SVIX calls, with equities rallying VIX is likely to keep dropping. We like the strike of $16 with the expiration of April 23rd, if you are not familiar with volatility this trade is not for you. The last trade we like this week is shorting the Canadian Dollar, we believe the best way to put this trade is via FX futures. If a trader wants to do this trade it is important they also keep an eye on Crude Oil (CL) prices since the Canadian Dollar has a high correlation with CL. Again it is important to note this trade is not for traders who are not familiar with FX trading.
Marco overview & Our view:
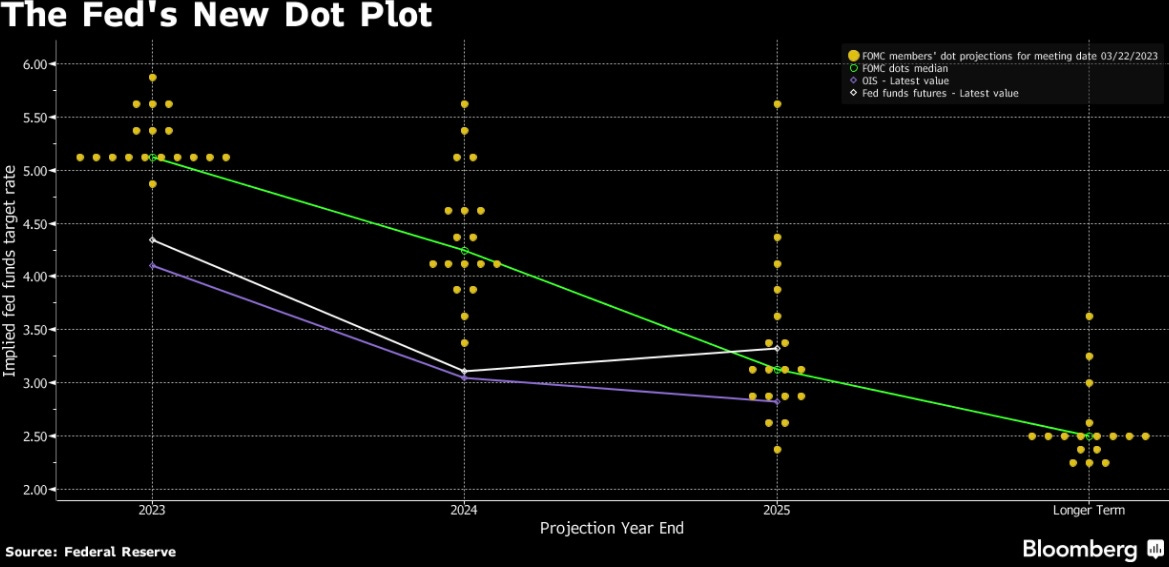
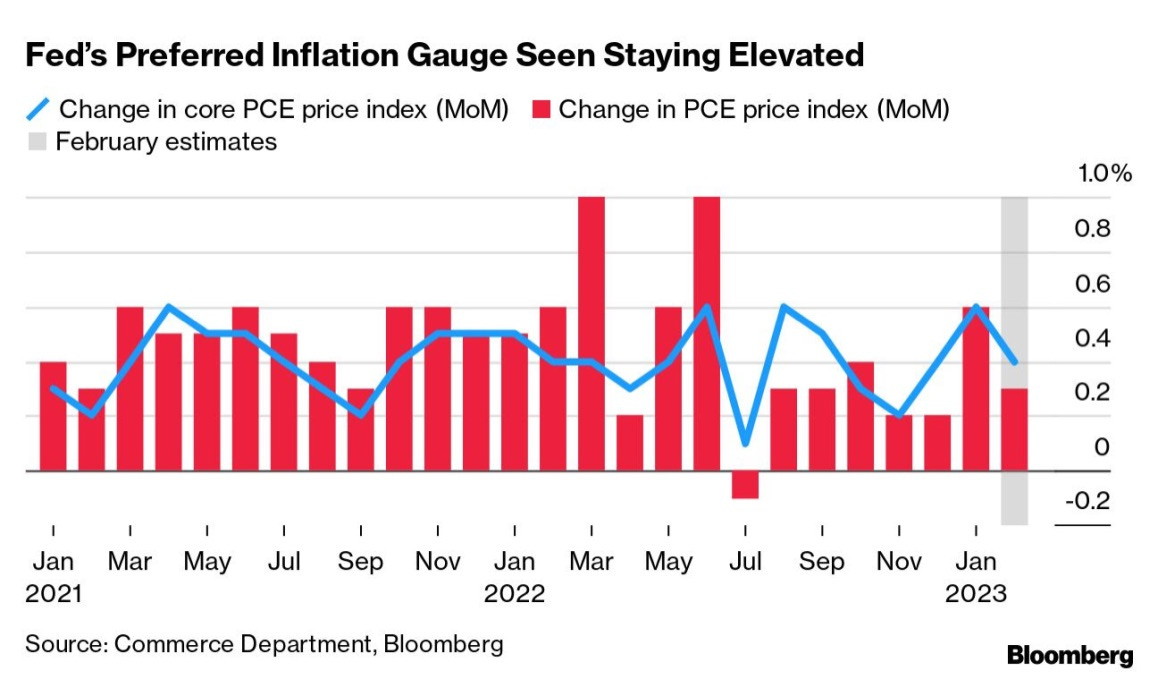
As we have mentioned many times in this week’s and last week’s newsletter we believe the FED raising 25 BPS was good but not as effective as a 50 BPS raise would have been. With the last FOMC release, we got a new FED Dot Plot seen in Figure 14. It is our view that inflation is still dangerously high and the FED has a large amount of work to do. As shown in Figure 15 the inflation metric the FED watches is still rather elevated. (Figure 15)
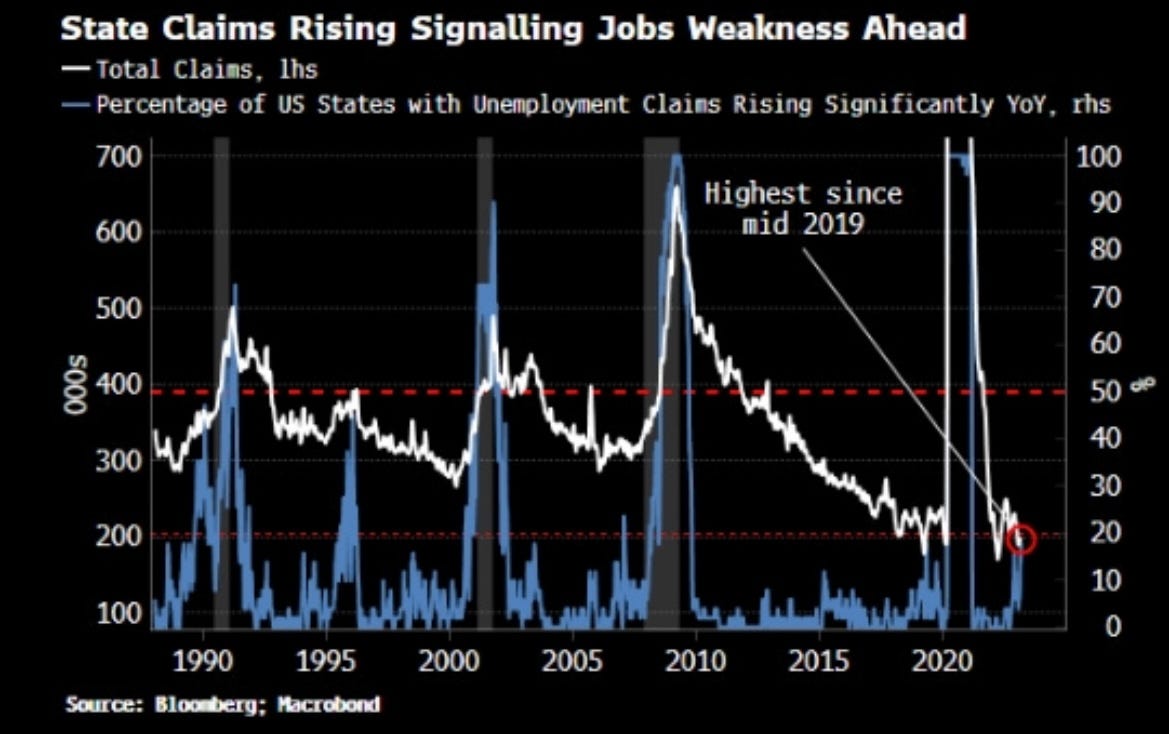
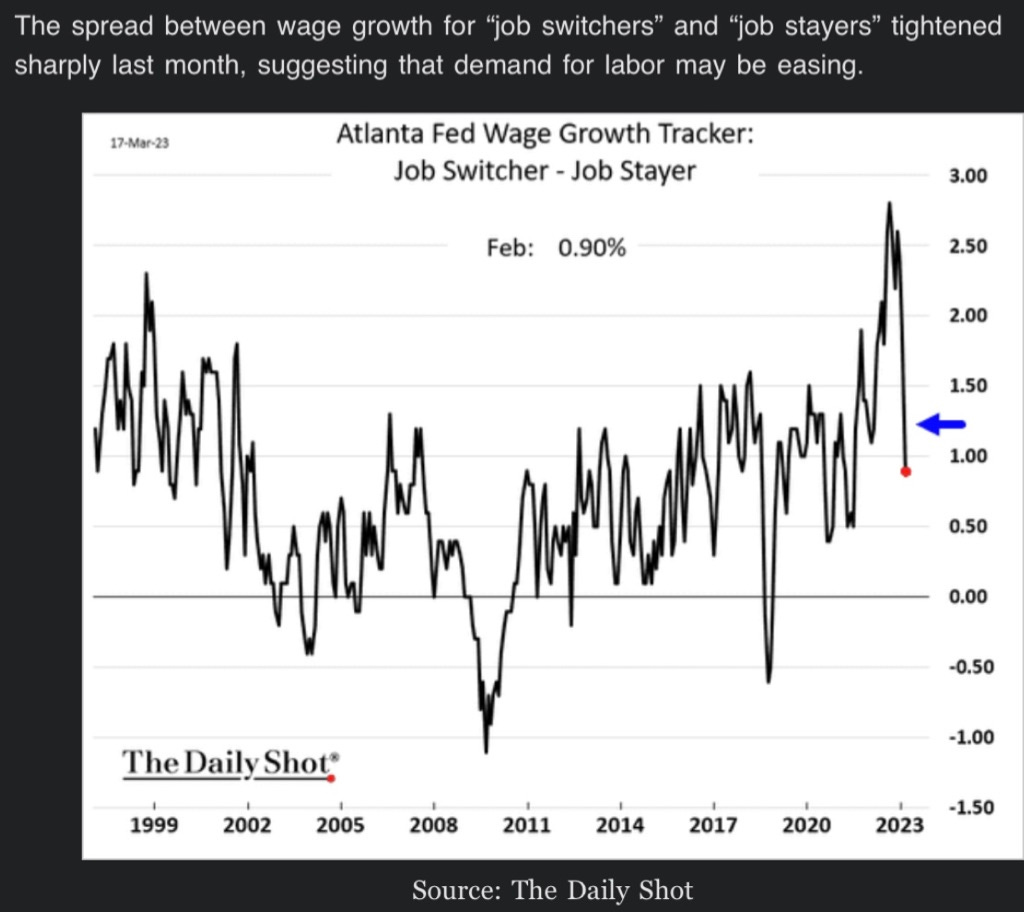
One good thing for the FED is that the labor market appears that it might be finally cooling off. The main two reasons we believe this is because one state jobless claims are increasing (Figure 16) and secondly the difference in wage between job stayers and job switchers has tightened. (Figure 17)
That is all for now, thank you for reading! Any feedback positive or negative is greatly appreciated!
DISCLAIMER: We are not Financial Advisors, and all information presented is for educational purposes ONLY. Financial markets can be extremely volatile, as such using good risk management is a must.