
Macro outlook for the rest of 2023 + Q1 2024 outlook
Macro outlook for the rest of 2023 + Q1 2024 outlook
My macro view on the rest of 2023 & Q1 2024.

Welcome
This will be the first (and hopefully not the last) of my Macro reports. I’ve always enjoyed Macro economics but in the past I found it hard to connect my views on Macro with markets. After reading several excellent Macro reports by Prometheus Research and
both of whom I highly recommend you check out their work. I feel like I can put my Macro thoughts into a report. That connects my views into a logical manor.Now as for what this report will cover we will quickly go over the global economy and foreign Central Banks. Then we will tackle the USA’s economy by exploring the current trends of inflation, production and what I will be watching asset wise these next couple of months. As always if you have any suggestions on content or any questions please feel free to leave a comment!
Global Economy
I will first start the report by sharing my views on the global economy including both Emerging markets (EM) and developed markets (DM).
The majority of Central Banks in developed markets have likely concluded their cycle of interest rate hikes. However, under my base case, which anticipates a robust global economy, I don't foresee rate cuts happening until the 2H of 2024. Another good data point for equity bulls is the solid growth of the global economy.The global economy has outperformed expectations in 2023, with GDP growth surpassing consensus forecasts by 1 percentage point (pp) globally and 2pp in the US. (Figure 1)
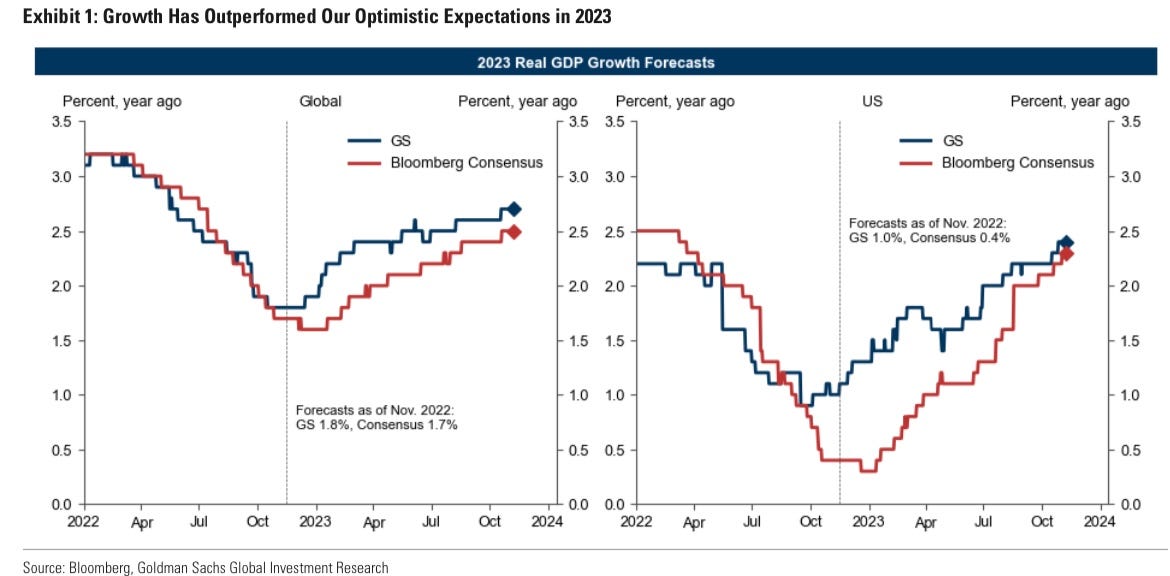
I believe that the large majority of this GDP headwind globally is likely due to the strong labor market. Across the globe but especially in the US (more on this later).
But that being said the fight with inflation globally is far from over. Shetler costs remain elevated globally, particularly in Australia, Canada, and other DMs with shorter mortgage duration. (Figure 2) There is also the geopolitical risk of the current situation in the Middle East expanding further.

Emerging Markets
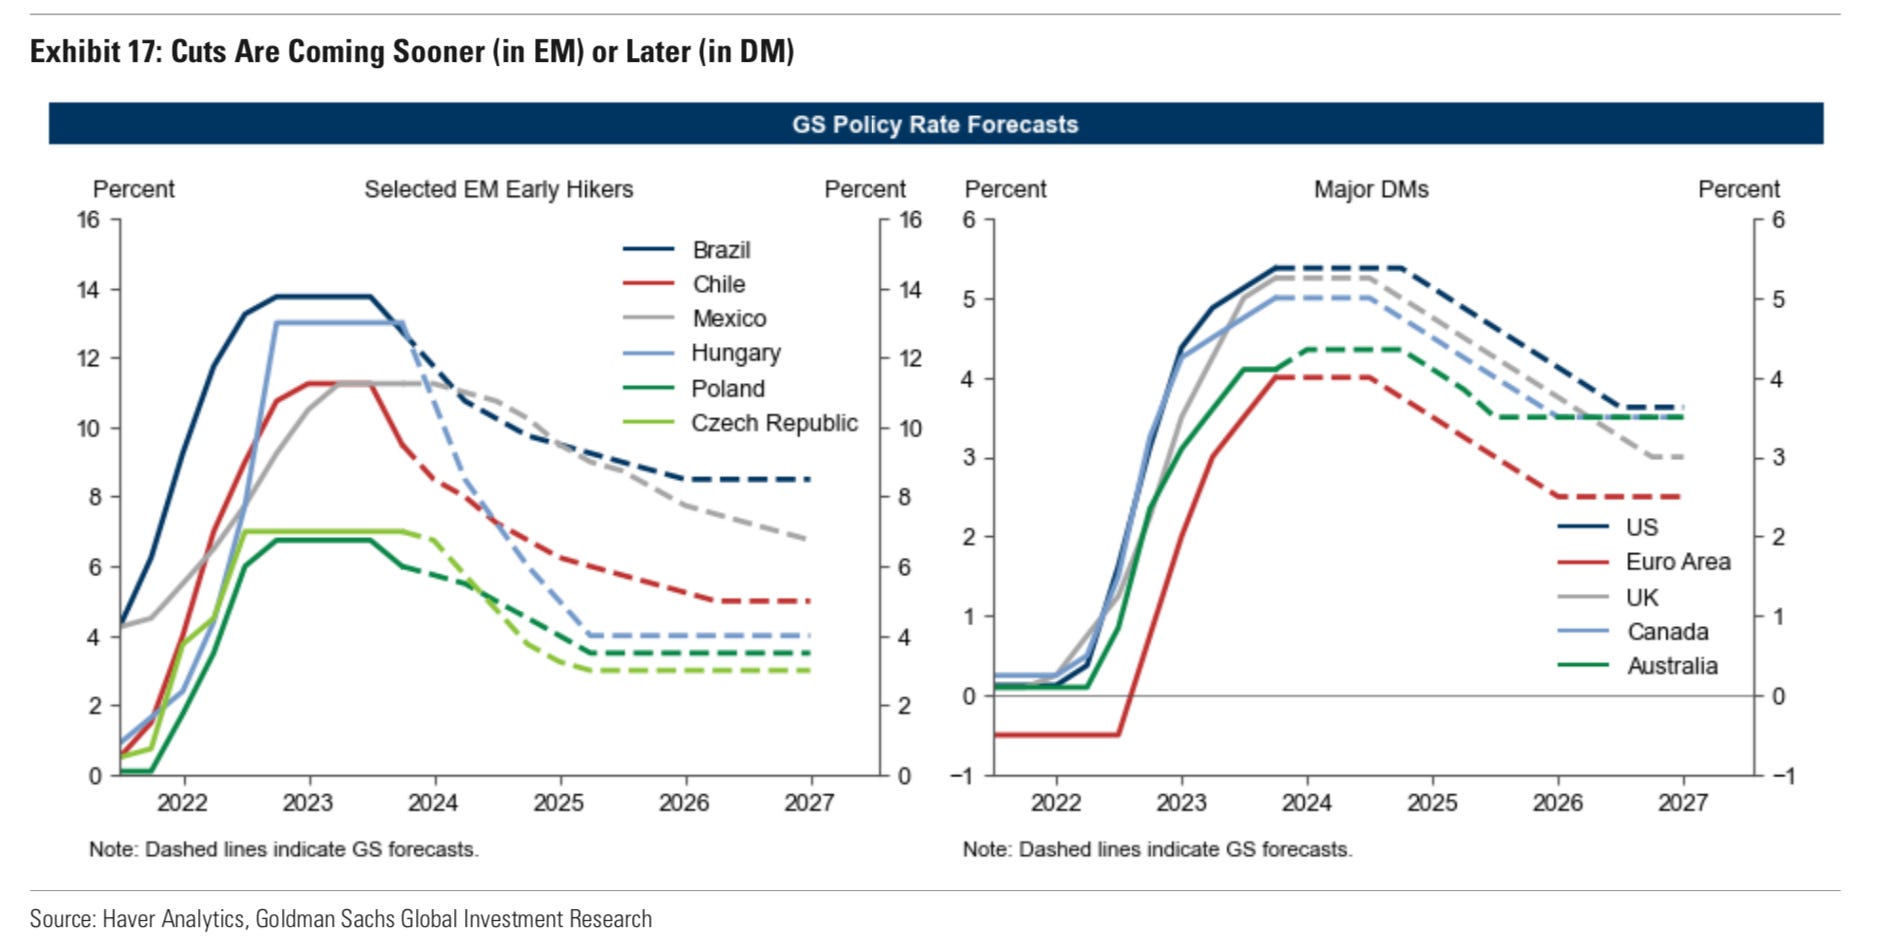
Despite observing a reduced barrier for rate reductions in 2024 and preemptive easing by some EM central banks, my economic thesis indicates that inflation will persist slightly above the target, especially in EMs. With Hungary, Brazil and Poland having the steepest path forecasted for rate cuts. (Figure 3)
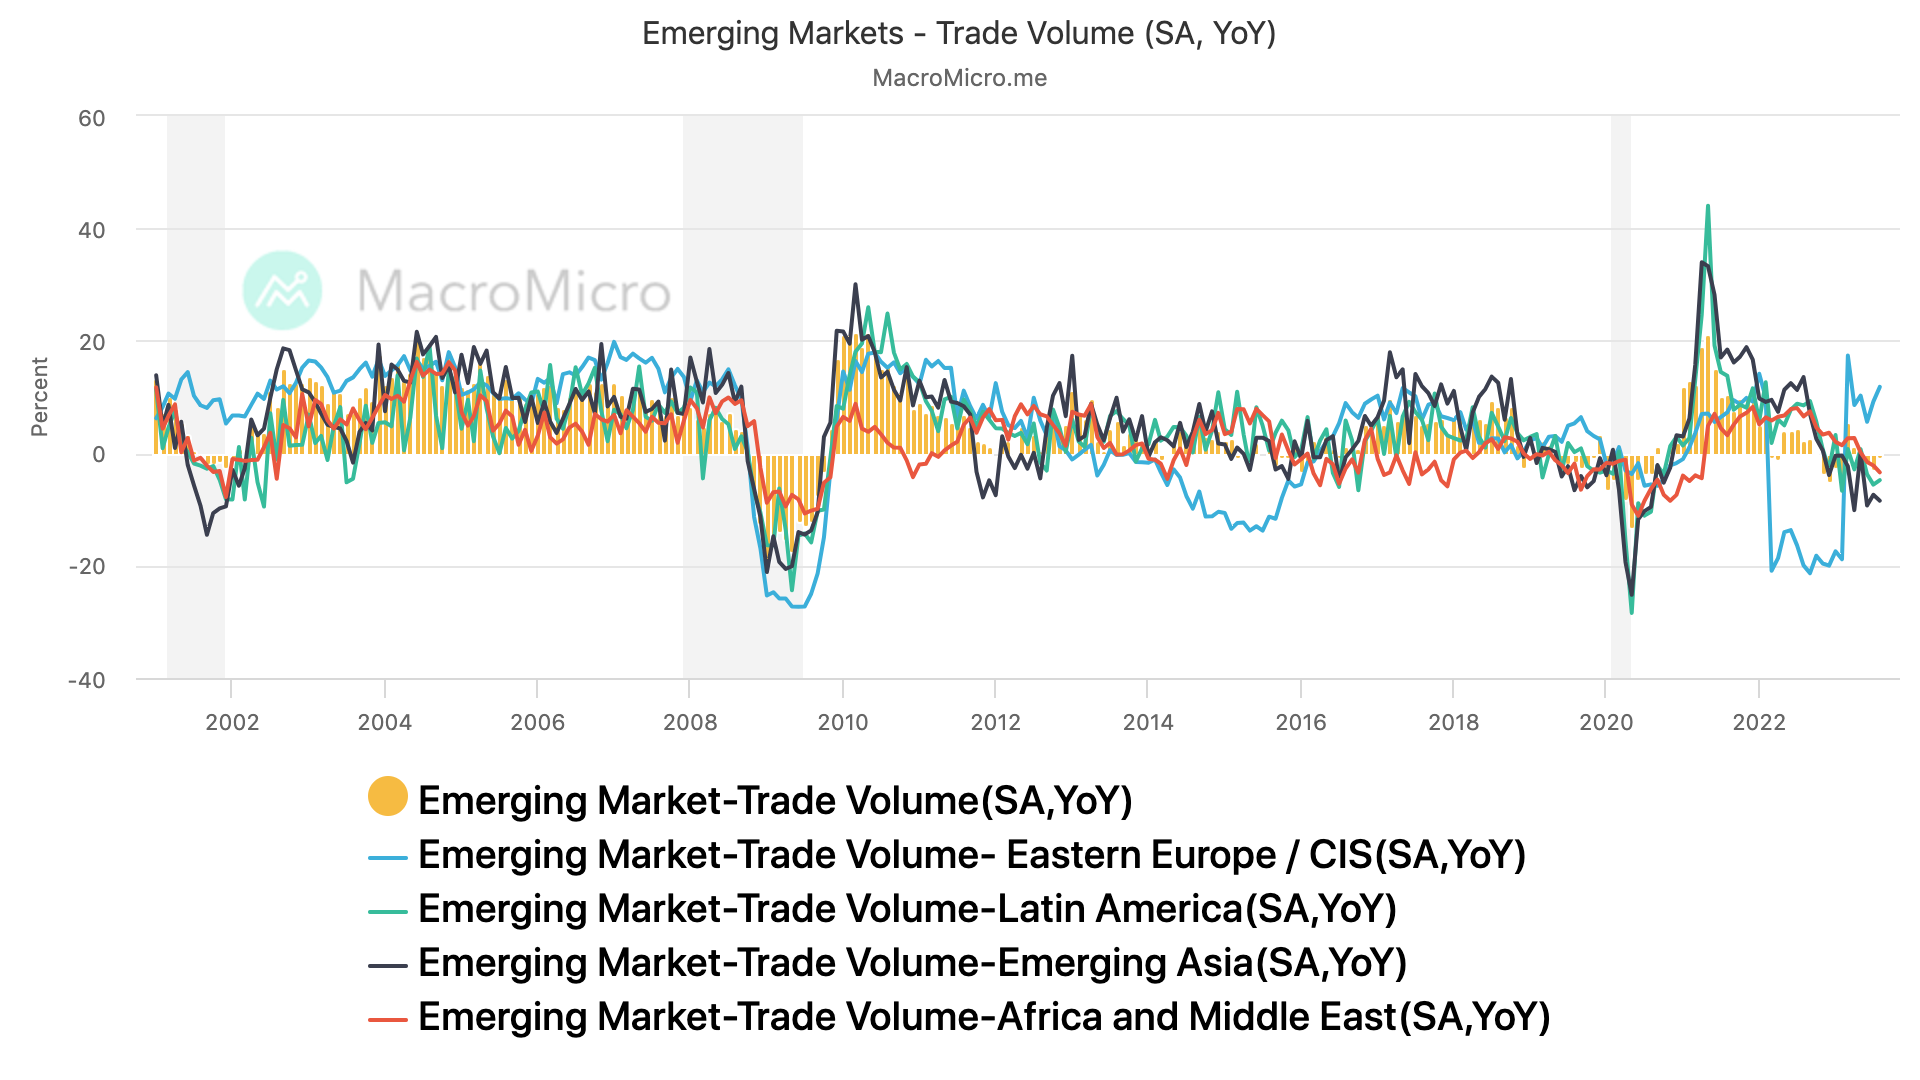
EM trade volume is slumping besides the notable exception of Eastern European markets. (Figure 4) This declining trade volume will likely effect these regions local currencies.
European Union
First on the list is the European Union (EU), the EU along with its island neighbor the United Kingdom are still working on cooling off their core inflation rates. (Figure 5)
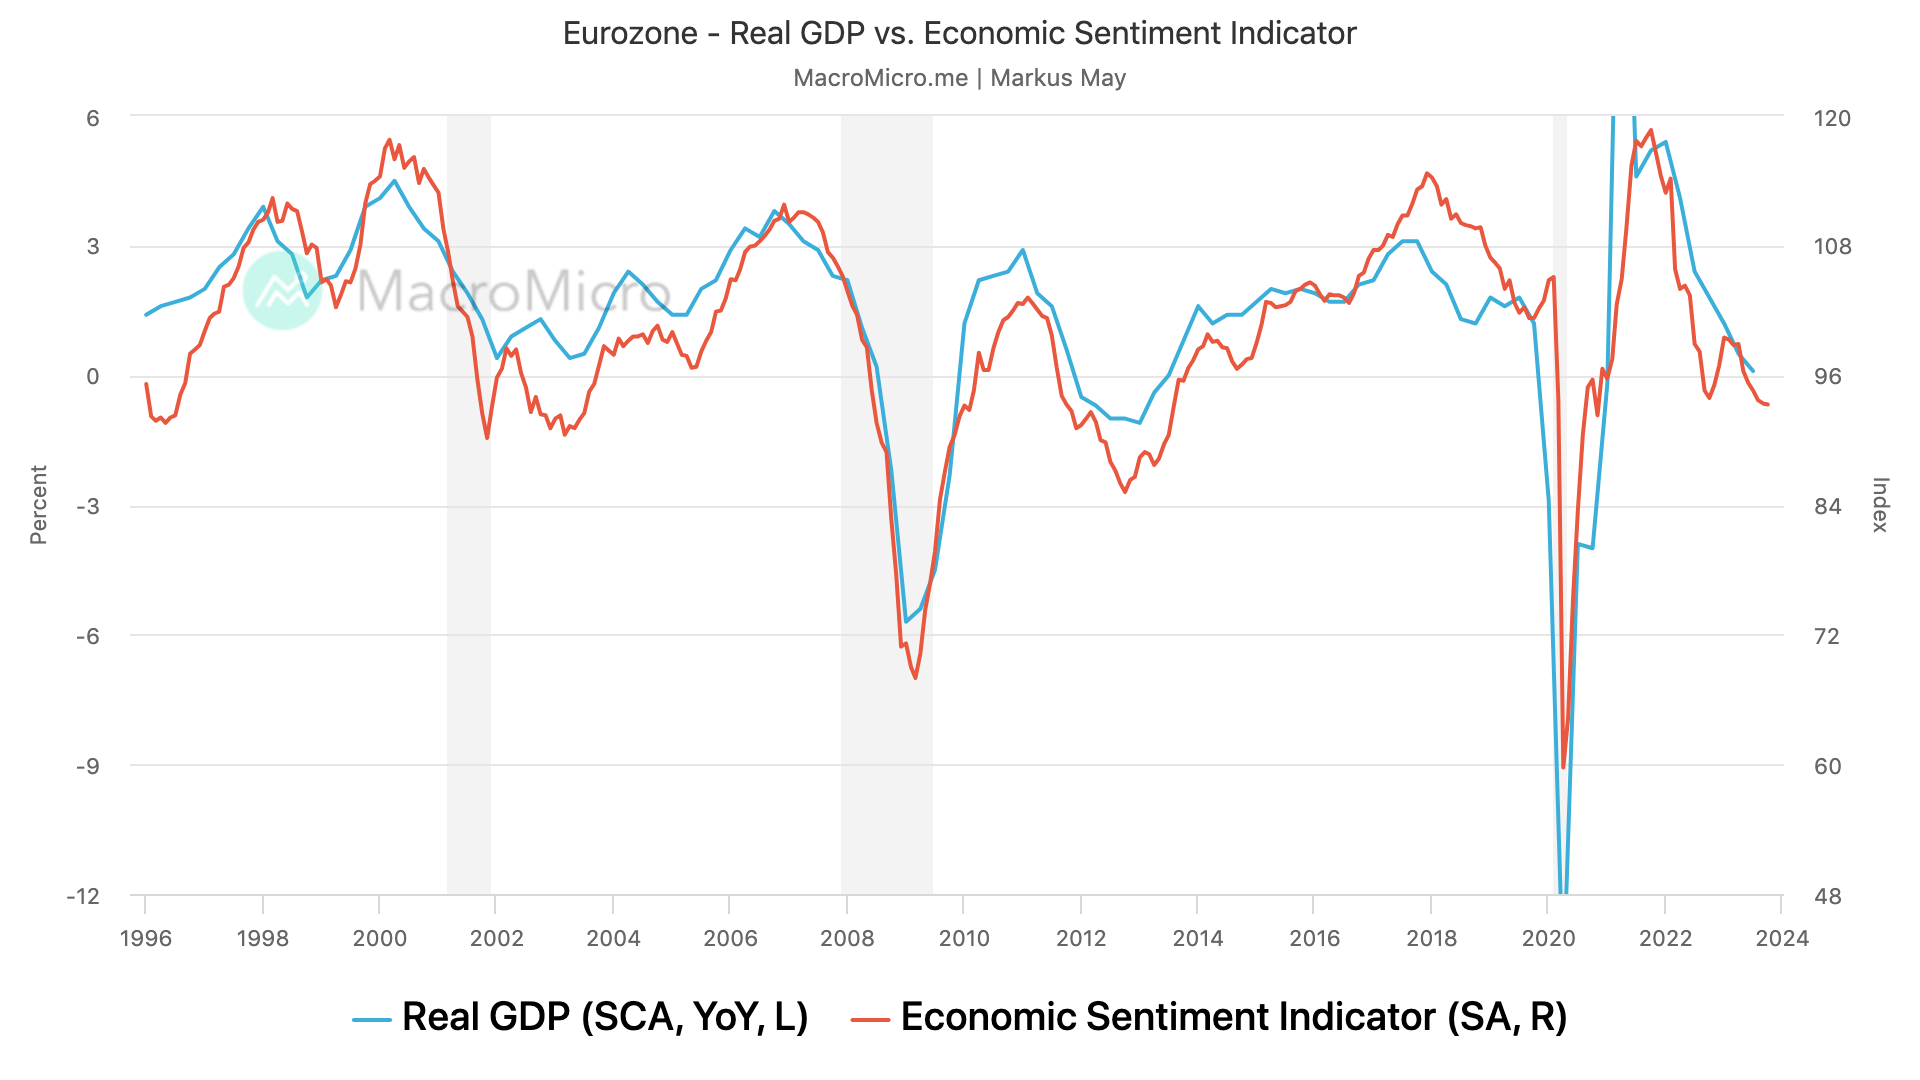
Real GDP growth has been dropped around 1% this year. (Figure 5) Which for the EU’s economy is not all that bad but with the Economic Sentiment Indicator falling off a cliff. (Figure 6) I think it is safe to guess the EU will print negative real GDP data points this quarter or next.
Eurozone Consumer Confidence is also looking extremely weak currently. (Figure 7)

For the reasons mentioned above along with Figure below I believe that the Euro Zone will enter a recession before the US does.

Inflation
Now the rest of this report will focus on the US economy, we will start with inflation. From a quick glance it may appear that the FED has beaten back inflation, with both MoM inflation (white line) and YoY CPI (yellow line) being below the EFFR (light blue line). (Figure 9) However, as I’m sure many of you know inflation tends to come in waves especially when there is such a sharp increase in inflation.
What do these inflation waves look like? Below are two examples of the waves of inflation taking form. (Figure 10 & 11) Figure 10 shows inflationary landscape from the early 1970s until approximately 1980. The first wave of inflation during this inflationary regime was also the largest with the next two waves being in comparison relatively tame. (Figure 10)

Figure 11 shows the inflationary regime during the GFC and a couple years after. Again the first wave of inflation was by the largest with two smaller periods of inflation. (Figure 11)

Figure 12 shown below, should only be taken as a way for me to show the possible inflationary waves for this cycle. I did not double check the math, etc so Figure 12 should be taken more as a napkin calculation. With that out of the way Figure 12 is a rough projection created by me, projecting a possible third wave of inflation. As you can see below there’s already been two clear waves of inflation, the first of which started around the midway point of 2020 until the middle of 2021 and the second wave taking place from March 2022 through September 2022. (Figure 12) One quick highlight I would like to make is the fact this inflationary cycle the first inflationary wave was not the largest. (Figure 12) So will we see the cursed third wave? It is impossible to know with an certainty at this stage but here are a few key things I will be watching to help spot a possible third wave of inflation. The key will likely be the cost of shetler and how heavily it effects future CPI prints.


Like most things related to inflation it will be very important to watch any and all data prints for inflation.
Productivity
In this section we will take a look at the labor market and manufacturing. Let’s start with the labor market, while the labor market is not as strong as before it is still extremely robust considering the 100s of BPS of hikes the economy has experienced since 2022.
As shown in the Figure below, nonfarm job prints have been decreasing recently but are still relatively strong. (Figure 14)

Along with hires looking decent, initial jobless claims has stayed below the 4-week average which is another solid sign for the US labor market. (Figure 15)

Manufacturing is another part of the US economy that was strong throughout 2023. The New York Federal Reserve, Dallas Federal Reserve, and Philadelphia Federal Reserve conduct surveys on companies to gather insights into their predictions regarding capital expenditures (Capex) over the upcoming six months. A favorable outcome indicates a prevalence of companies anticipating an increase in future Capex as opposed to those expecting a reduction.
Capital expenditures often function as a lagging indicator for the manufacturing sector. An upward trend in Capex signifies robust demand and an escalation in production. Conversely, Capex experiences a downturn when inventory surpasses new orders. A peak in anticipated future Capex signals ongoing momentum for manufacturing growth. With a decline in Capex maybe suggesting potential corrections in the manufacturing sector. In my view this might be an interesting data point to watch for a major pullback in the manufacturing sector. (Figure 16)

Finally, below in Figure 17 you can see non-manufacturing PMI is still holding strong above the 50 point level.
FX + Misc.
XCCY
Constricted EUR/USD basis: Starting from July, the basis for EURUSD has contracted to its most elevated point since 2022. It also mirrors an economic actuality that has proven more robust than initially anticipated. The gradual decline in EUR liquidity: In the foreseeable future, the only foreseeable reduction in EUR liquidity will arise from the ECB's Asset Purchase Program runoff, leading to a monthly decrease of EUR 30 billion. Although the PEPP runoff might contribute an additional 20 billion per month, this will only commence in the middle of 2024. USD liquidity: Since the summer, USD liquidity has surged due to the significant issuance of treasury bills versus coupons by the US Treasury (more on this later), drawing liquidity away from the Fed's Reverse Repurchase Facility (RRP). However, this situation is not sustainable indefinitely. The RRP facility now stands at $1 trillion, and the US Treasury has exceeded its own recommended limit of bills not exceeding 20% of the total outstanding debt. The complexity lies in the fact that these dual forces could sustain USD liquidity over the next few quarters before an inevitable drainage begins.


Credit/F.I.
Credit spreads across the different ratings are looking normal and not under stress. (Figure 20)


Trades on my watchlist
Now for some trades and key levels I will be watching going into the end of the year.
Rates:
Long BB rated CLO.
I do not believe that this trade will be ready until some time next year. However, when the BoE begins rate cuts I believe the R:R for longs on the 10Y Gilt will be extremely worthwhile. (Figure 22)
Longs on SR3H2024 are somewhat appealing to me around this level. (Figure 23) Below in Figure 23 I also included my specific R:R.

Equities:
LONG: AXSM 0.00%↑ is a biotech company with a major catalysts by the end of this year. I hope to write an article just for AXSM 0.00%↑ so I will save most of the information for that article. (Figure 23)
Short: I think shorting the DAX near its YTD high is a pretty solid R:R. (Figure 25)

Conclusion
A massive thank you to everyone, I am hoping to be able to take Celeritas Capital to the next level. Although instead of diving head first I think it’s smarter if I slowly ease into this. My plan is to get at least one post out every week.
I am also extremely excited to announce a new project I am working on. The goal of the project is to share more of my trade ideas, executions, and reasoning behind these trades. I will be sharing more in depth information in an individual post for the project very soon!
DISCLAIMER: We are not Financial Advisors, and all information presented is for educational purposes ONLY. Financial markets can be highly volatile, so good risk management is a must.
Looking forward to reading this going forward - nicely done.
This is an excellent macro overview, I thoroughly enjoyed it. I am excited to see how you build it out. If there is any way I can help out, don't hesitate to ask.