
Long Reds in the EU & UK
A Quick Write Up on a STIR Trade

Welcome to all the new subscribers I appreciate you subscribing and I want to let you know I will continue improving Celeritas Capital. Paid subs help me pay for new data sets and help with the creation of new models so a big thank you to them. I also of course need to thank returning subscribers some of which have been following my work for years now!
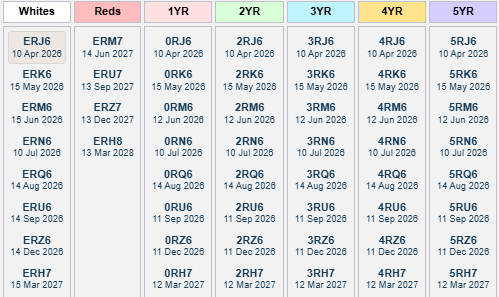
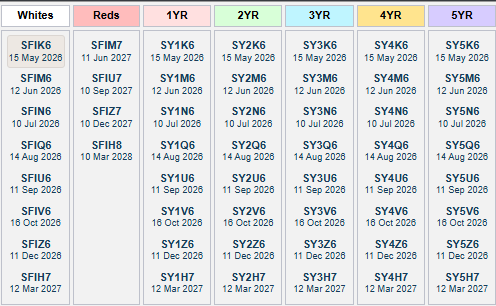
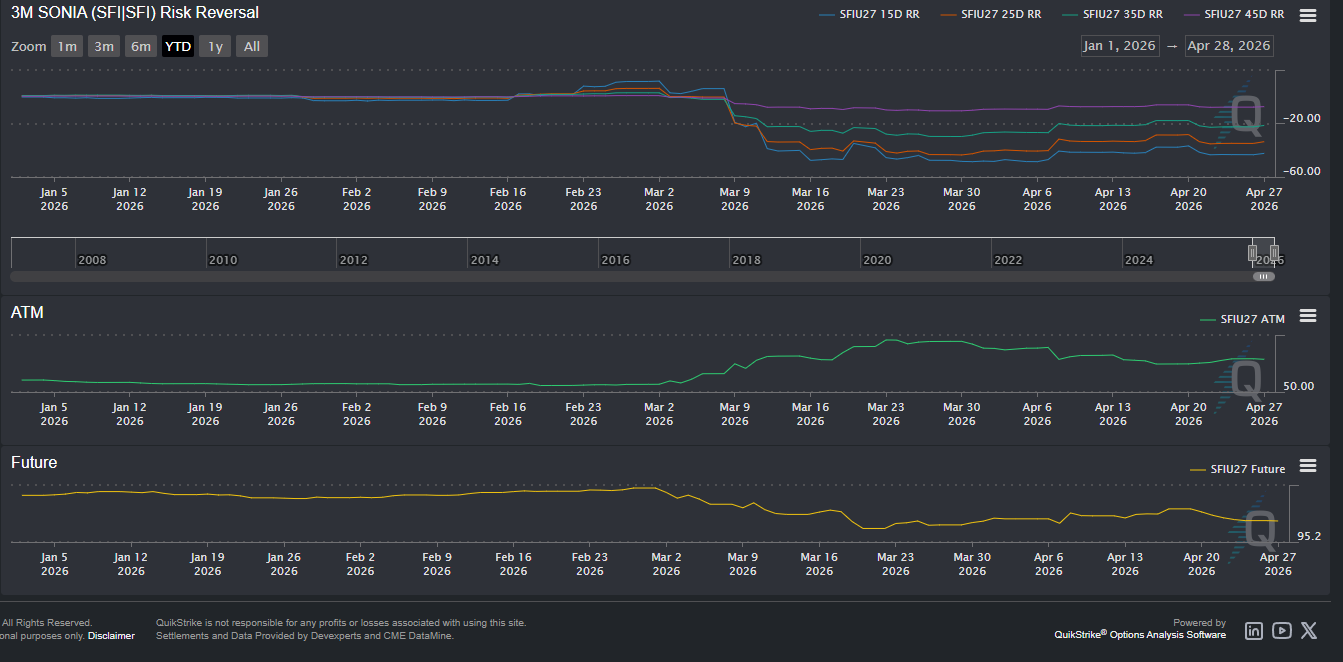
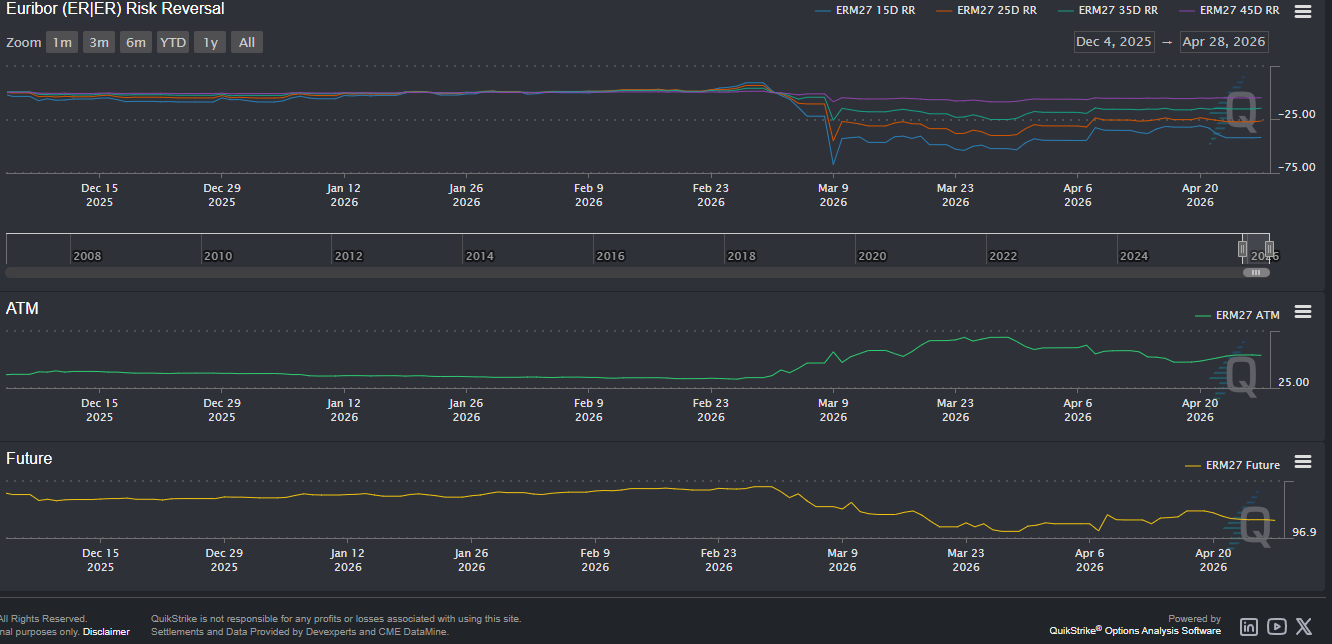
In today’s article I am going to layout my logic behind another STIR trade this time focusing on reds in Europe and the UK. If you’re not familiarly with EURIBOR or SONIA when I say that I am referring to 3 month EURIBOR futures (EURIBOR) which trade as IZ2026 on Tradingview and ERZ26 most other places. Or 3 month SONIA futures which trade as SO3Z2026 on Tradingview and SFIZ26 most other places. As for the term ‘red’ it is the slang for the STIR contracts that follow the first four expirations (I believe) Figure 1 & Figure 2 and from QuikStrike and help explain the jargon.
EU Economy and Crude Scenarios:
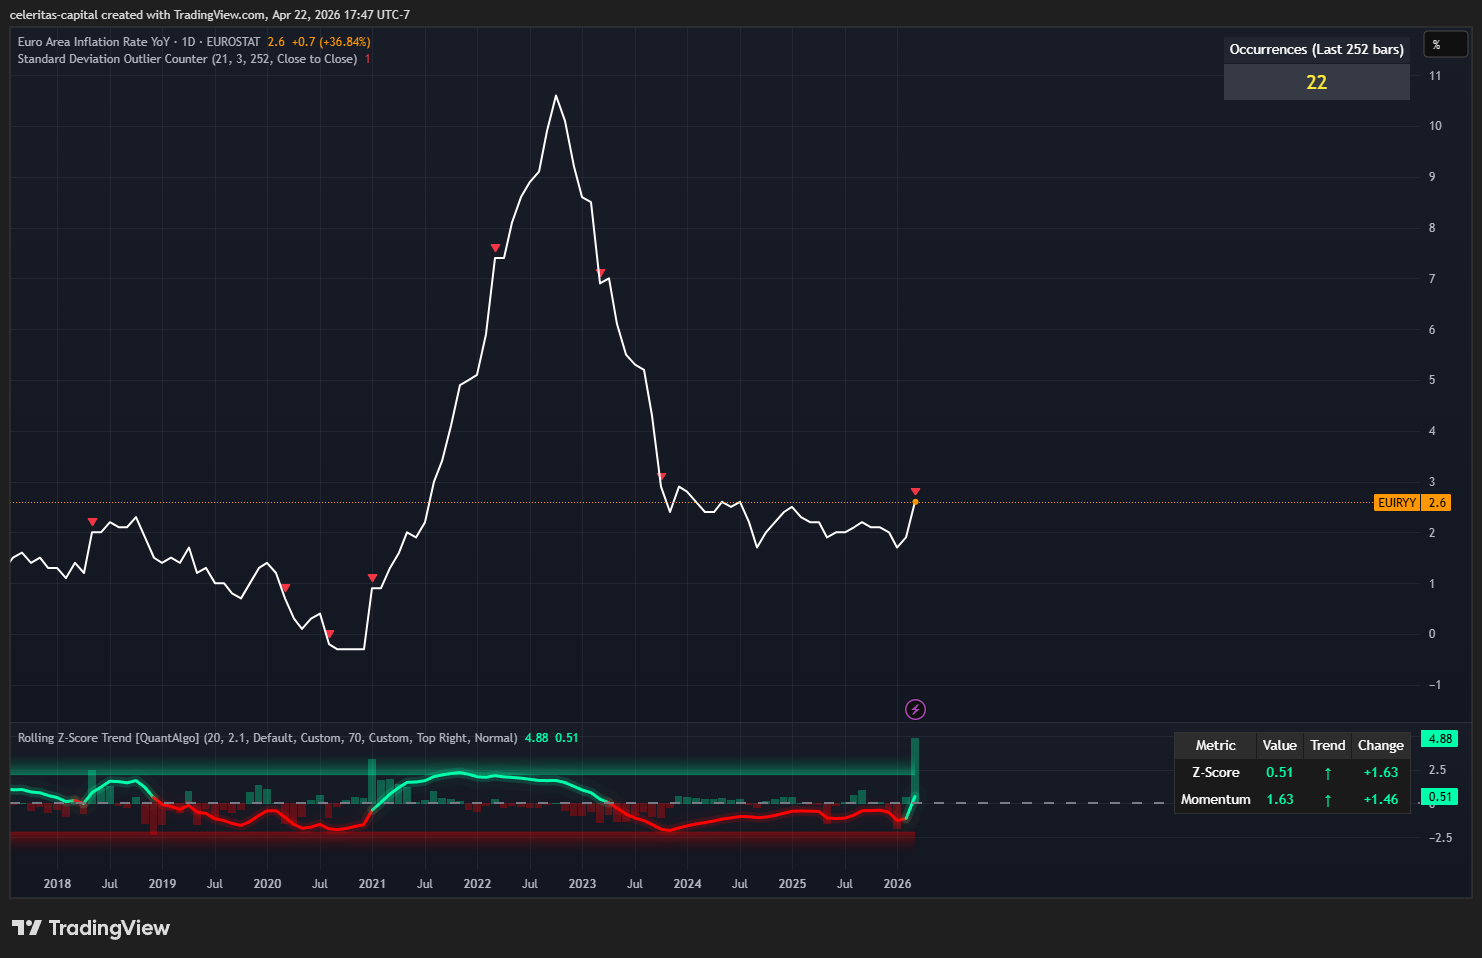
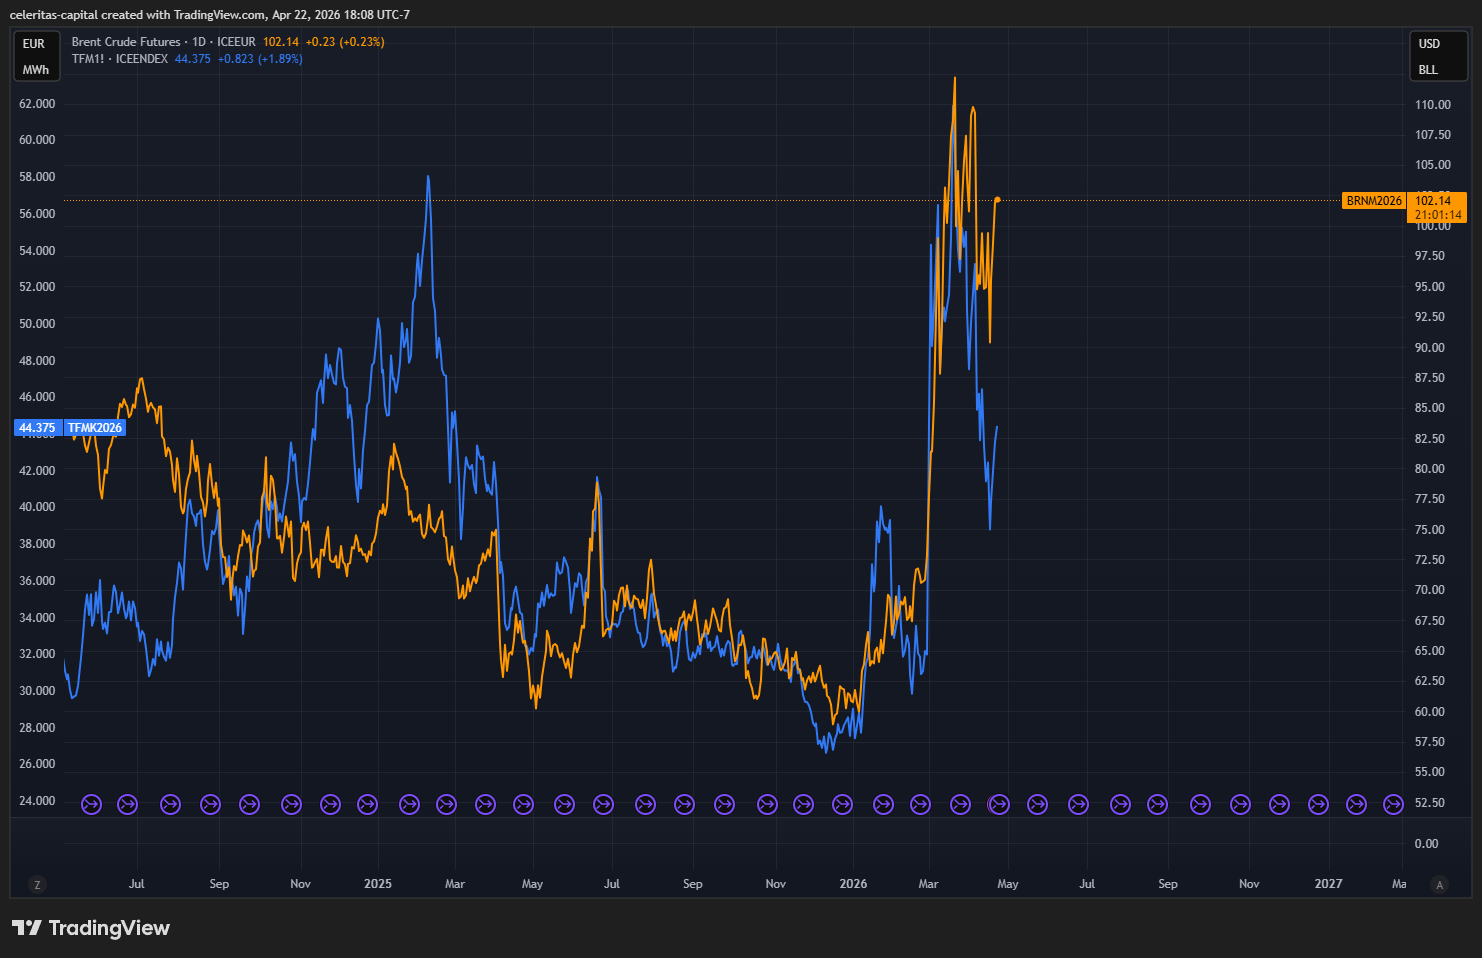
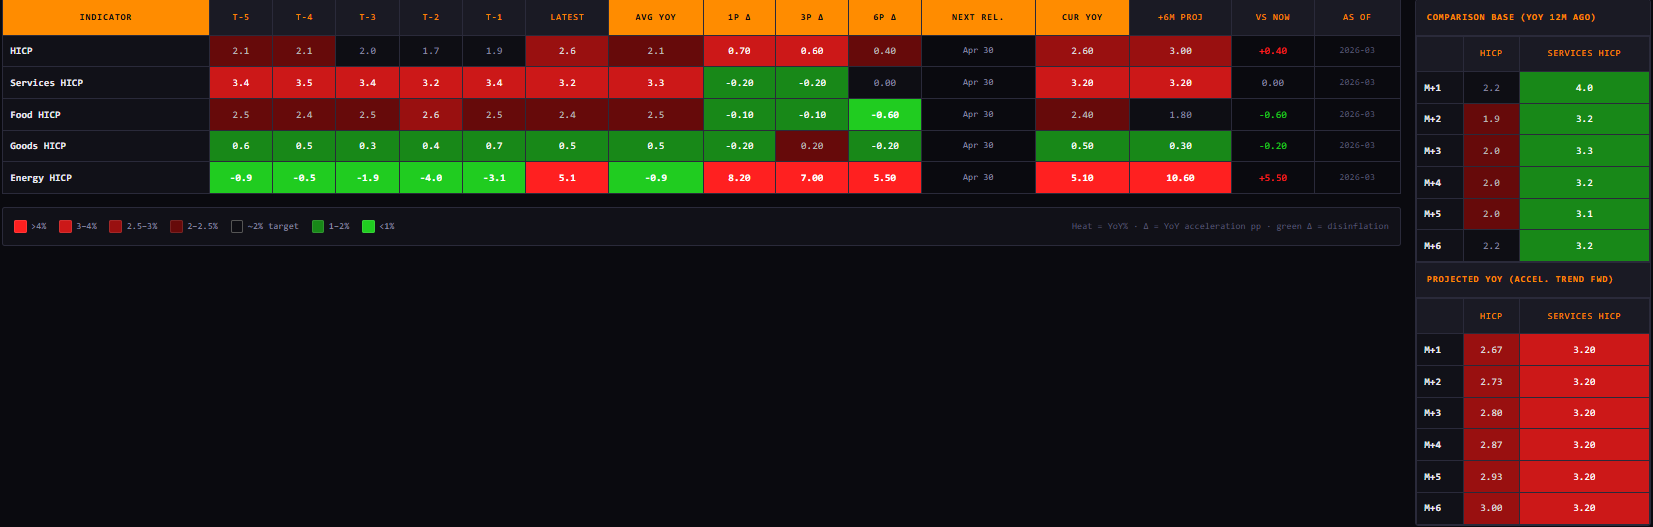
Taking a look at inflation first the Euro Area inflation rate YoY recently printed at hot 2.6%. (Figure 3) Which is an outlier according to standard deviation, this was primarily driven by energy prices skyrocketing due to the war in Iran. This is driven home by the Figure 4 as well as in my inflation model for the Euro Zone adapted from work done by Alfie Kerswell.(Figure 5)
Now onto how to read this model, HICP standards for harmonised index of consumer prices pretty similar to the CPI print here in America. The other four categories are self explanatory, the model is simply a momentum model. Red equals inflation over the target rate of 2% YoY, green is the opposite. T-1 is one data print ago so in this case it is the reading from February 2026 and so on for the columns, 1P Δ / 3P Δ / 6P Δ are acceleration/deceleration measures in percentage points. To me the inflation picture in the Euro Zone is most definitely heating up due to war in Iran and the knock on energy price increase. With that being said headline inflation is still sticky but not out of control. In 6 months time the model projects HICP at 2.80 YoY. A few important notes this model is momentum based so please take that into consideration. If you are like me and curios what the inflation picture would like with crude at different levels well you are in luck because I mapped out three cases for crude related inflation, base case, bull case and bear case. I will expand further on what each of these paths stem from and leads to.
Inflation Base Case:
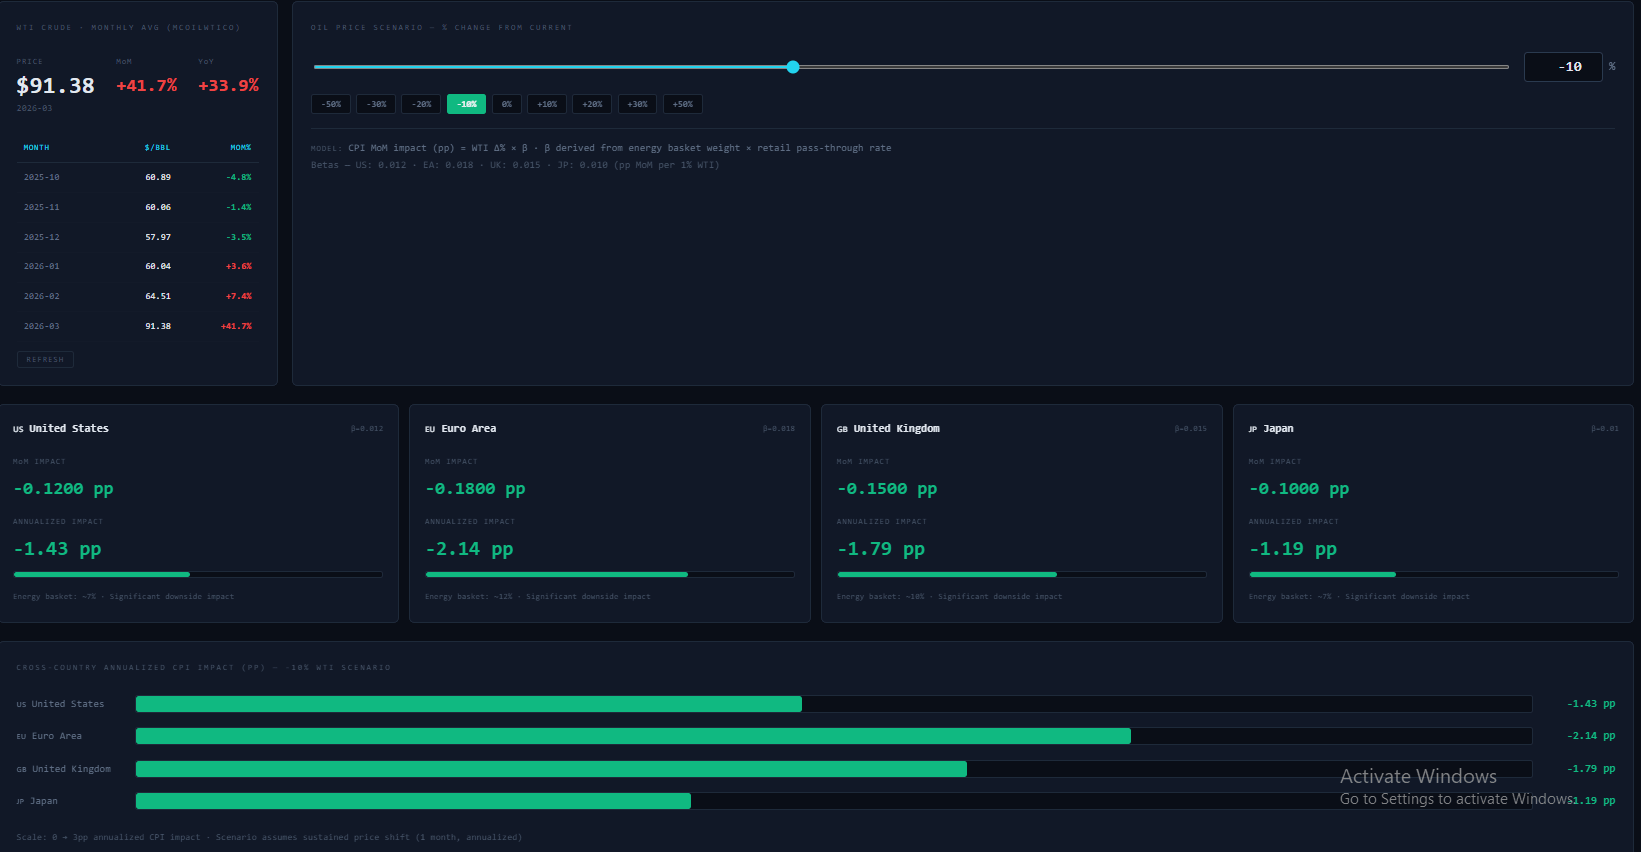
My base case is informed by a few things the current price of CLZ26 as well as option pricing. Along with the classic TACO Trump function and the upcoming midterms I don’t think it is crazy to have oil at $82 a barrel in six months time as my base case. In Figure 6 you can see my base case for EU inflation. If we take the MoM impact of the price of crude on the EU HICP according to my model we get -0.54 YoY on the contribution of Crude to EU inflation. That puts my projects in my base case HICP will print around 2.26 YoY in 6 months time. If my project is close that hardly seems like an environment the ECB would hike rates in.
Inflation Bull Case:
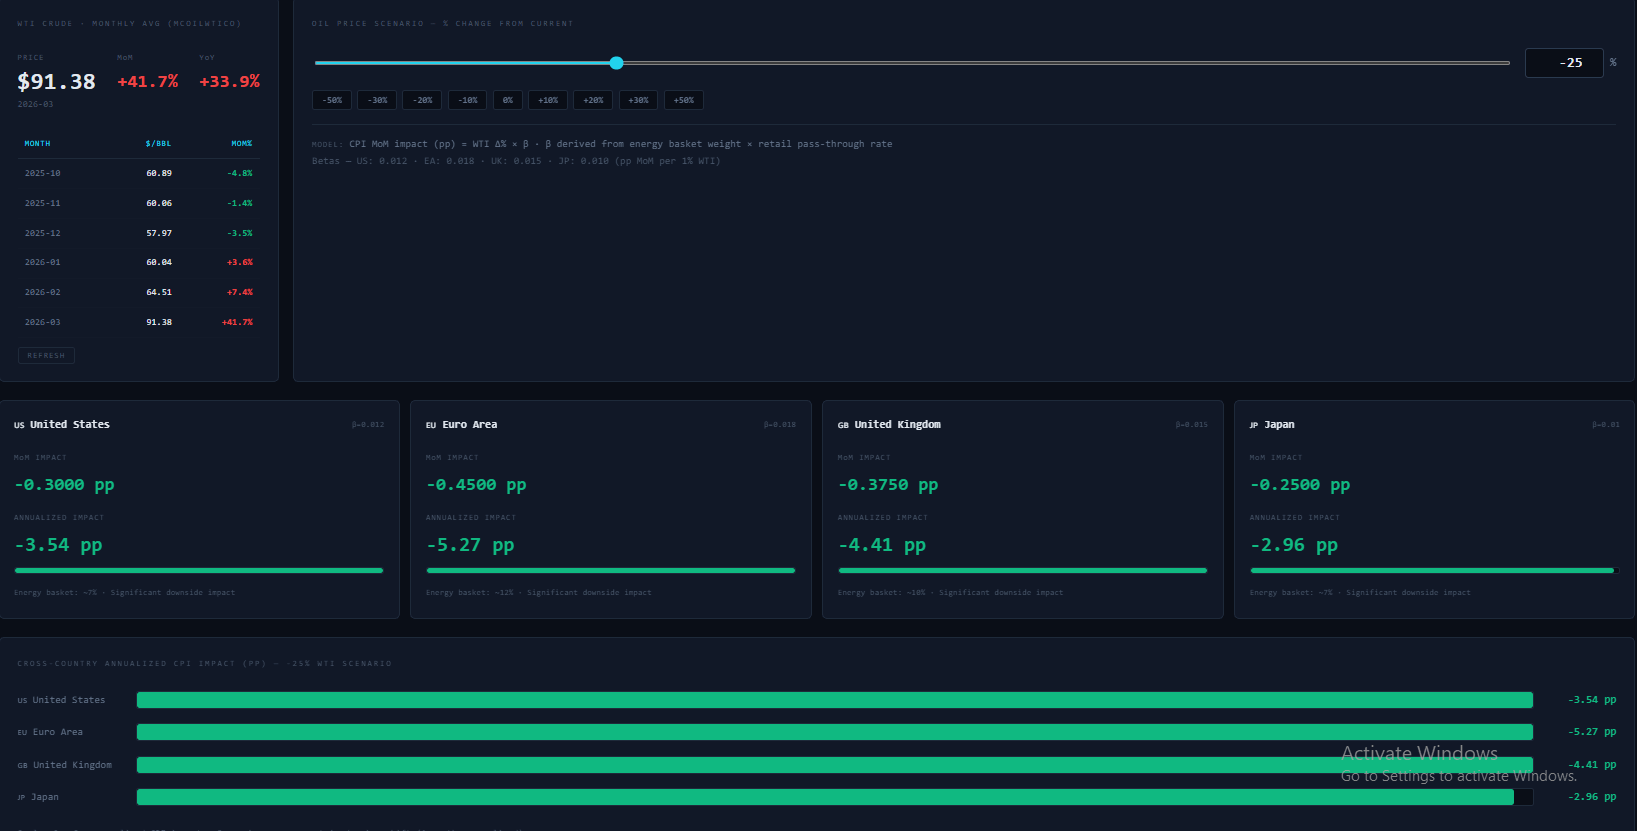
Quick defining of bull case here, it is what I believe the best case for lower inflation in the EU looks like. A near peace in the middle east type deal. This scenario has oil around $68.50 for the next six months. Figure 7 shows that this model probably needs some finetuning as it shows this would drop inflation in the EU by -5.27 YoY to HICP. I think this is a bit extreme so I am going to half it to -2.635 YoY to HICP. Which would put my six month projection in the bull case for HICP at 0.50 YoY. Which is extremely unlikely as the services sector had inflation pick up in the most recent print but the two models are separate. I find this case the least likely.
Inflation Bear Case:
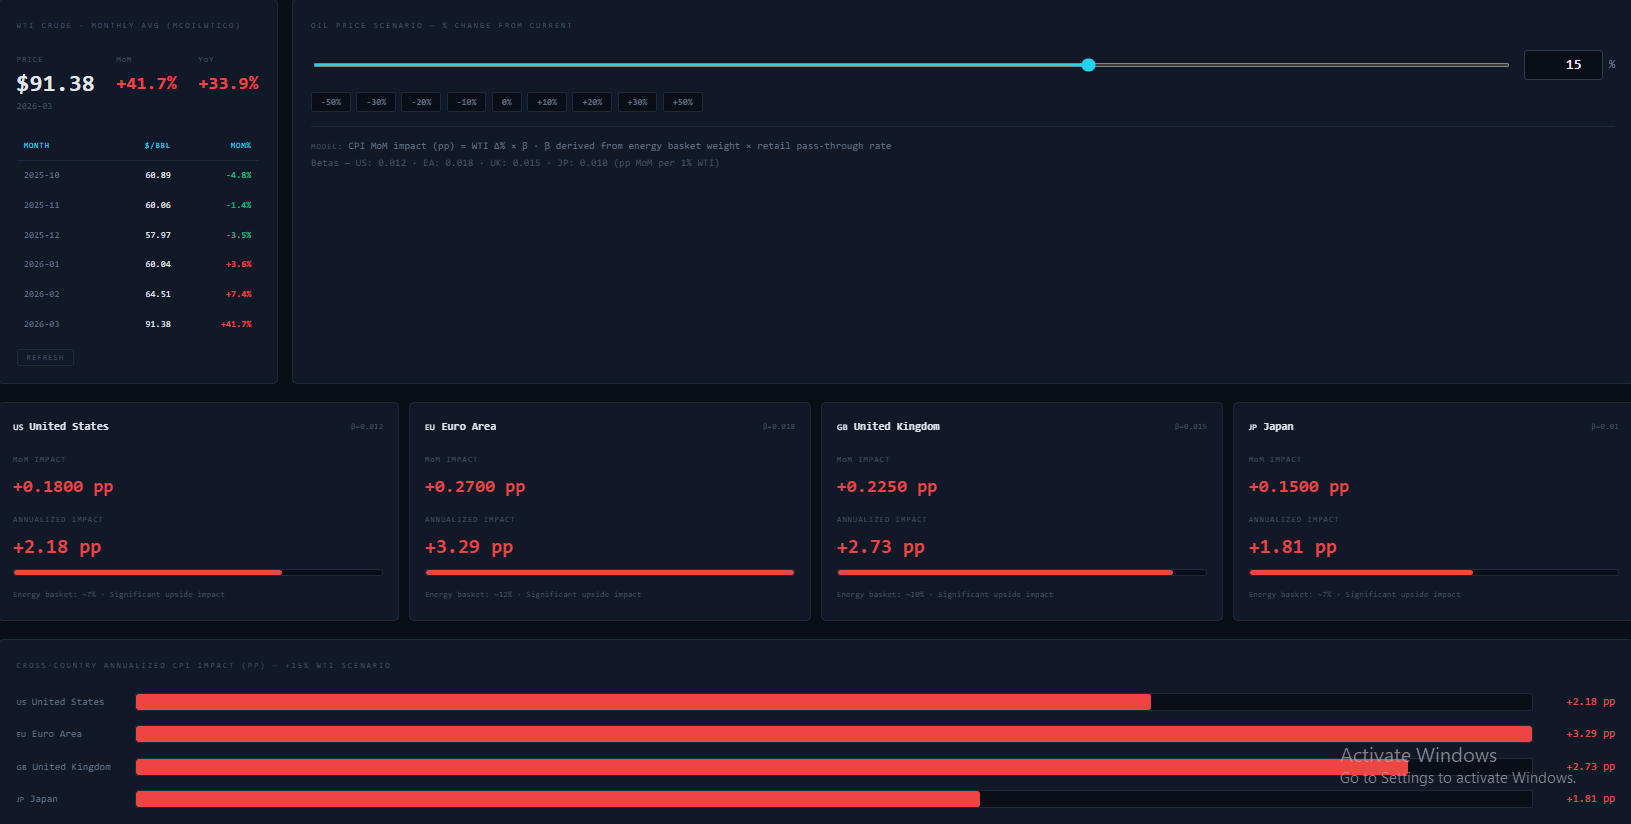
Now onto the inflation bear case, this scenario sees oil spiking to $105 a barrel and staying there for a significant amount of time. Figure 8 shows the model sees inflation spiking sharply in the EU. After some adjusting on my end in this case my projection for HICP is 4.445 YoY. Which does make hikes look a lot more certain in my view. This is also a scenario that would invalidate the trade for EURIBORs.
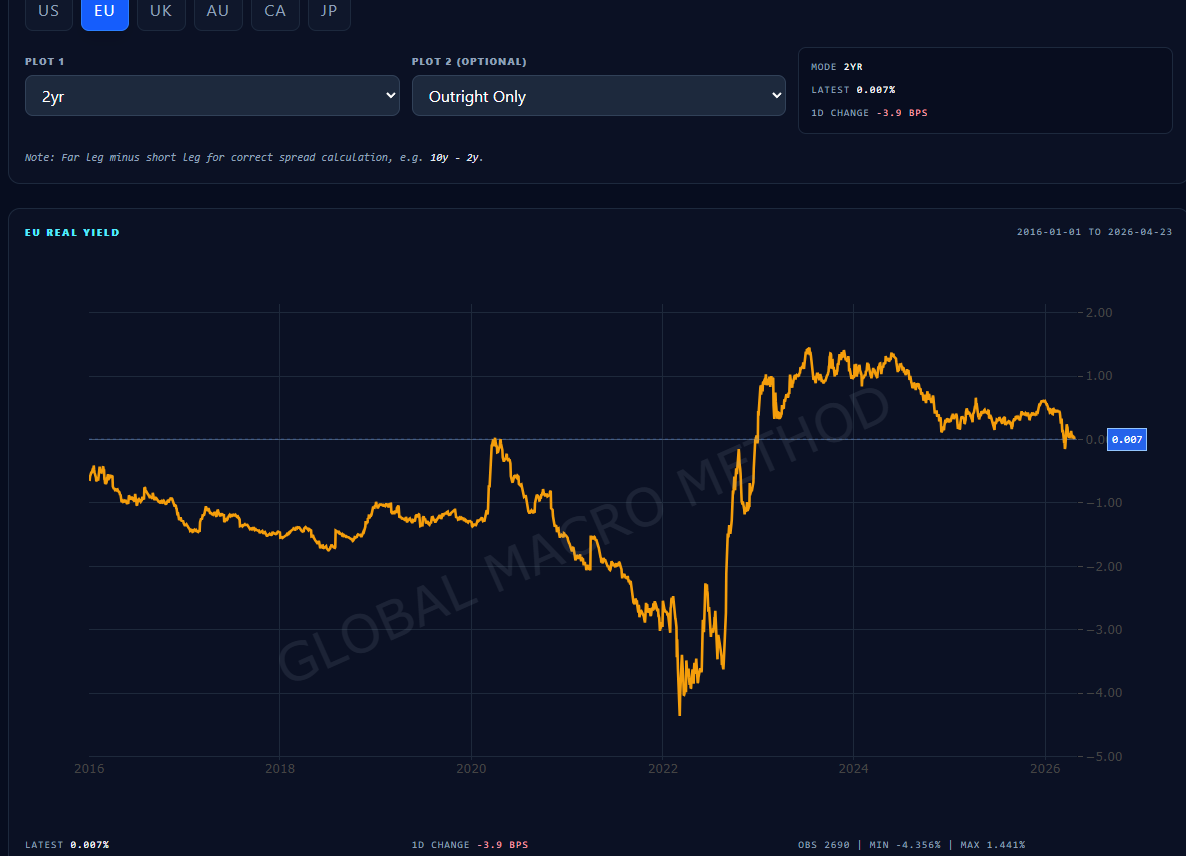
The 2 Year Real Rate in the Eurozone have been dropping since the start of this year. This can be seen in Figure 9, which is courtesy of Global Macro Method I’m very thankful he lets his subscribers share some of the amazing stuff he has got on his dashboard. If you’re not already subscribed to him I can’t recommend his work enough. But the 2 year real rate dropping even with the backdrop in Iran. This reads like market saying “rates are high enough to roughly match inflation, but not high enough to create much real tightness” Where do I think the ECB will take rates? I think we could very likely see one insurance hike sometime in 2026. With cuts likely coming in 2027.

UK Economy:
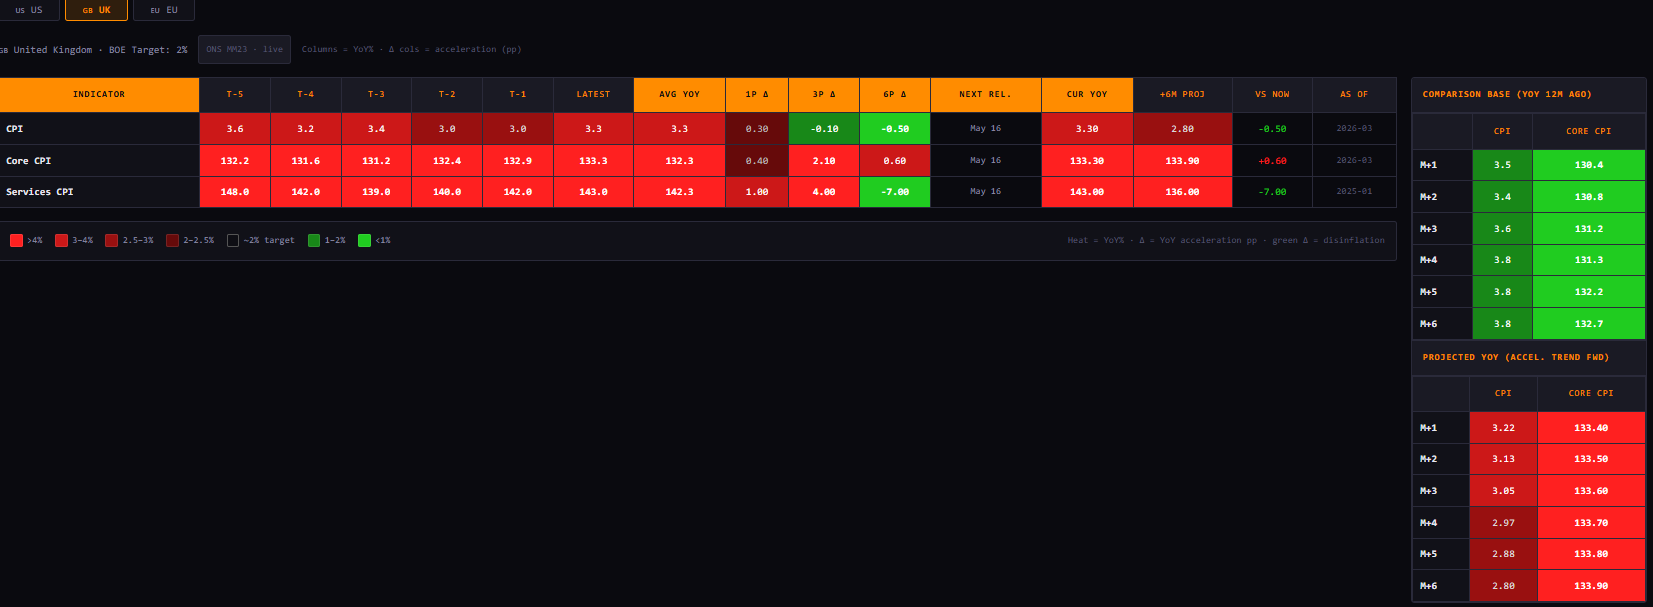
The UK is in a similar place to the EU economically speaking. Both were on track to a soft landing with cuts priced in as early as 2026 in earlier in the year. Energy was also the main thing causing UK inflation to spike to 3.3 YoY during the most recent print. (Figure 11) Although I will note Services CPI also printed slightly higher as well in March. (Figure 11) My inflation momentum model still shows that compared to 6 months ago inflation is slightly down YoY. (Figure 11) Similar to Europe I read this inflation as hotter in the near term due to crude and geopolitical factors but the disinflation will continue in the longer term even if it is sticky.
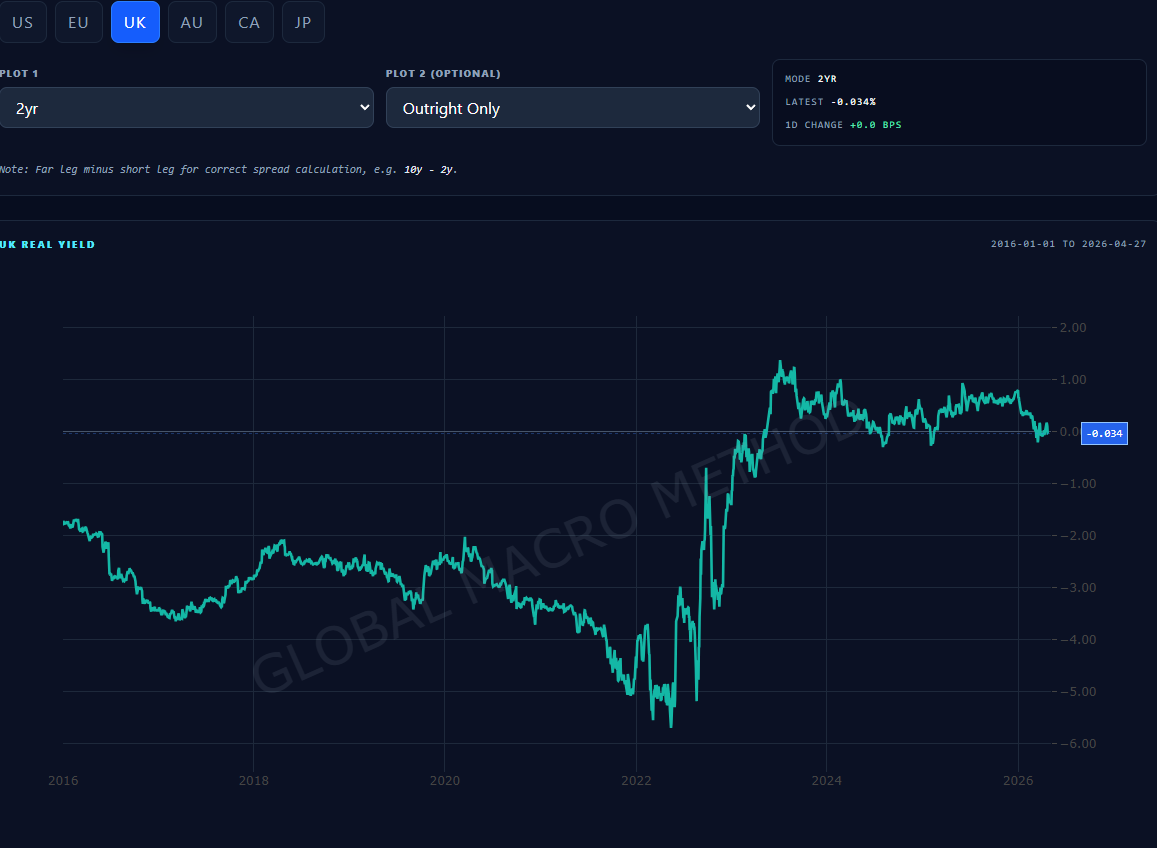
The 2-year real rate complicates the picture a bit more complex. UK inflation is cooling on a 6-month basis, but the front-end real rate is no longer tight enough to confidently force inflation back to 2%. That makes the next 12 months look like slow, sticky disinflation rather than a smooth return to target. The best case for the UK economy is the bull case outlined above. As for rates I see a possible insurance hike in 2026 with rates likely coming down in 2027 a cut or two.
Trade Expression:
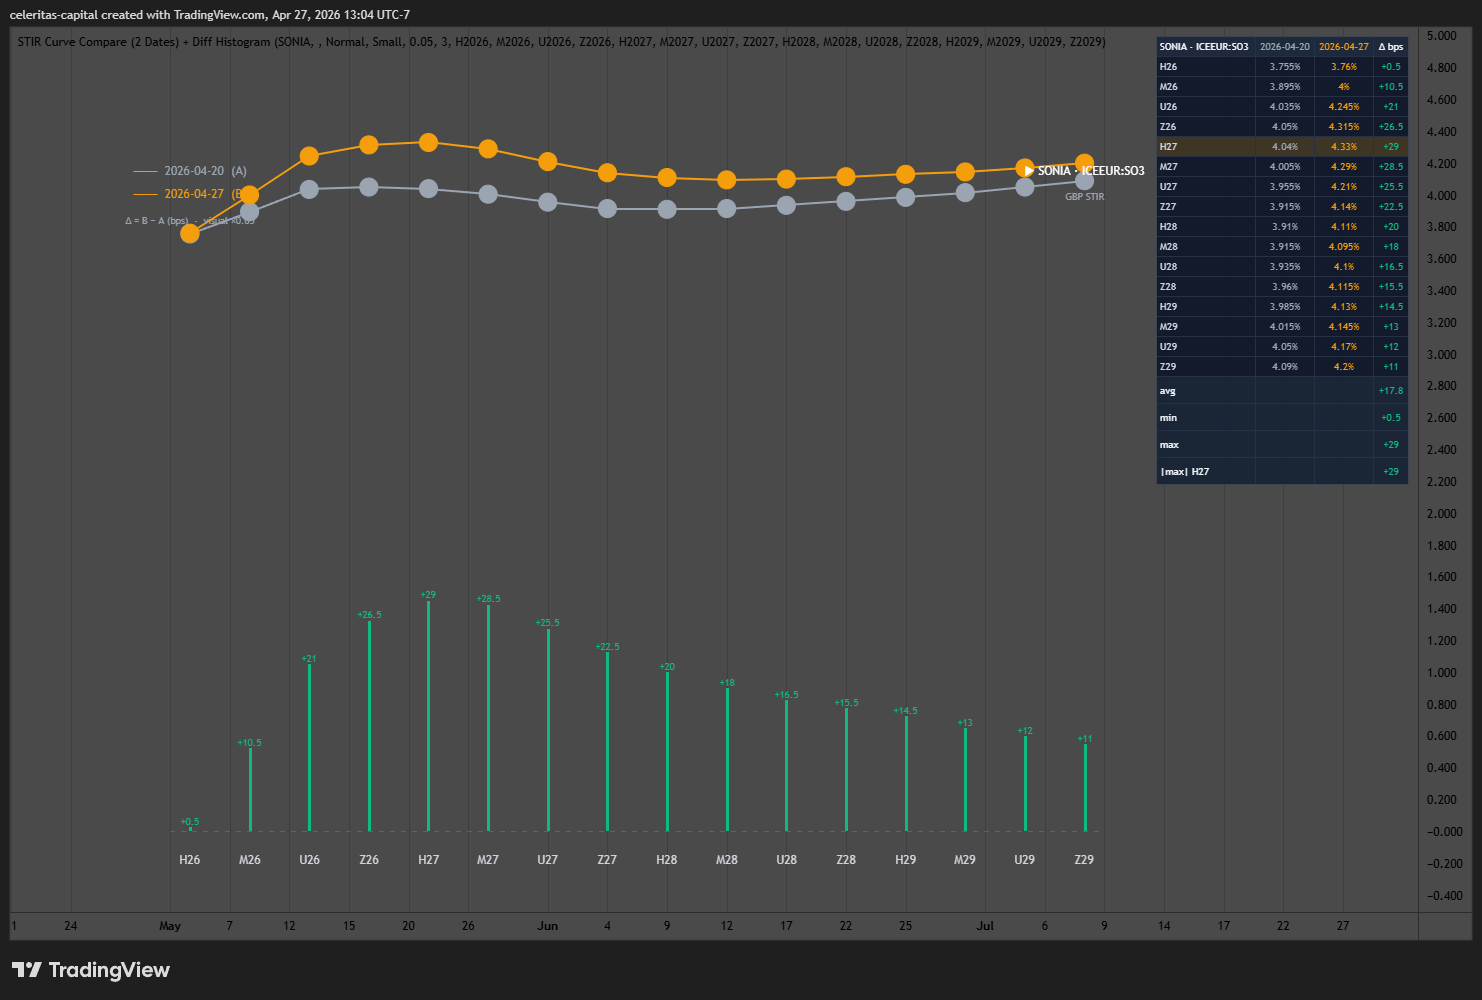
Now onto trade expression I personally like the simplest way to play the views expressed above. Which for the EU is long ERM7 and for the UK it is long SFIU7. The implied rate for SFIU7 roses 28.5 bps in the last 7 days. I believe we will see this correct in the coming months. The SONIA curve is pricing in the BoE holding rates into the 4%s through 2027. I believe we will see lower rates in 2027, with the current geopolitical risks a forgotten memory in early 2027 I think the BoE will take back their insurance hike and the market will start pricing in cuts.
What Validates the Trade: Inflation rolling over after an initial spike. Growth deterioration. The curve pricing cuts in 2027, Hormuz resolution that gets ships flowing again is great for the trade.
What Invalidates the Trade: Further tension in the Middle East isn’t good for this trade. Inflation broadening beyond energy related spikes. FX weakness in the GBP.
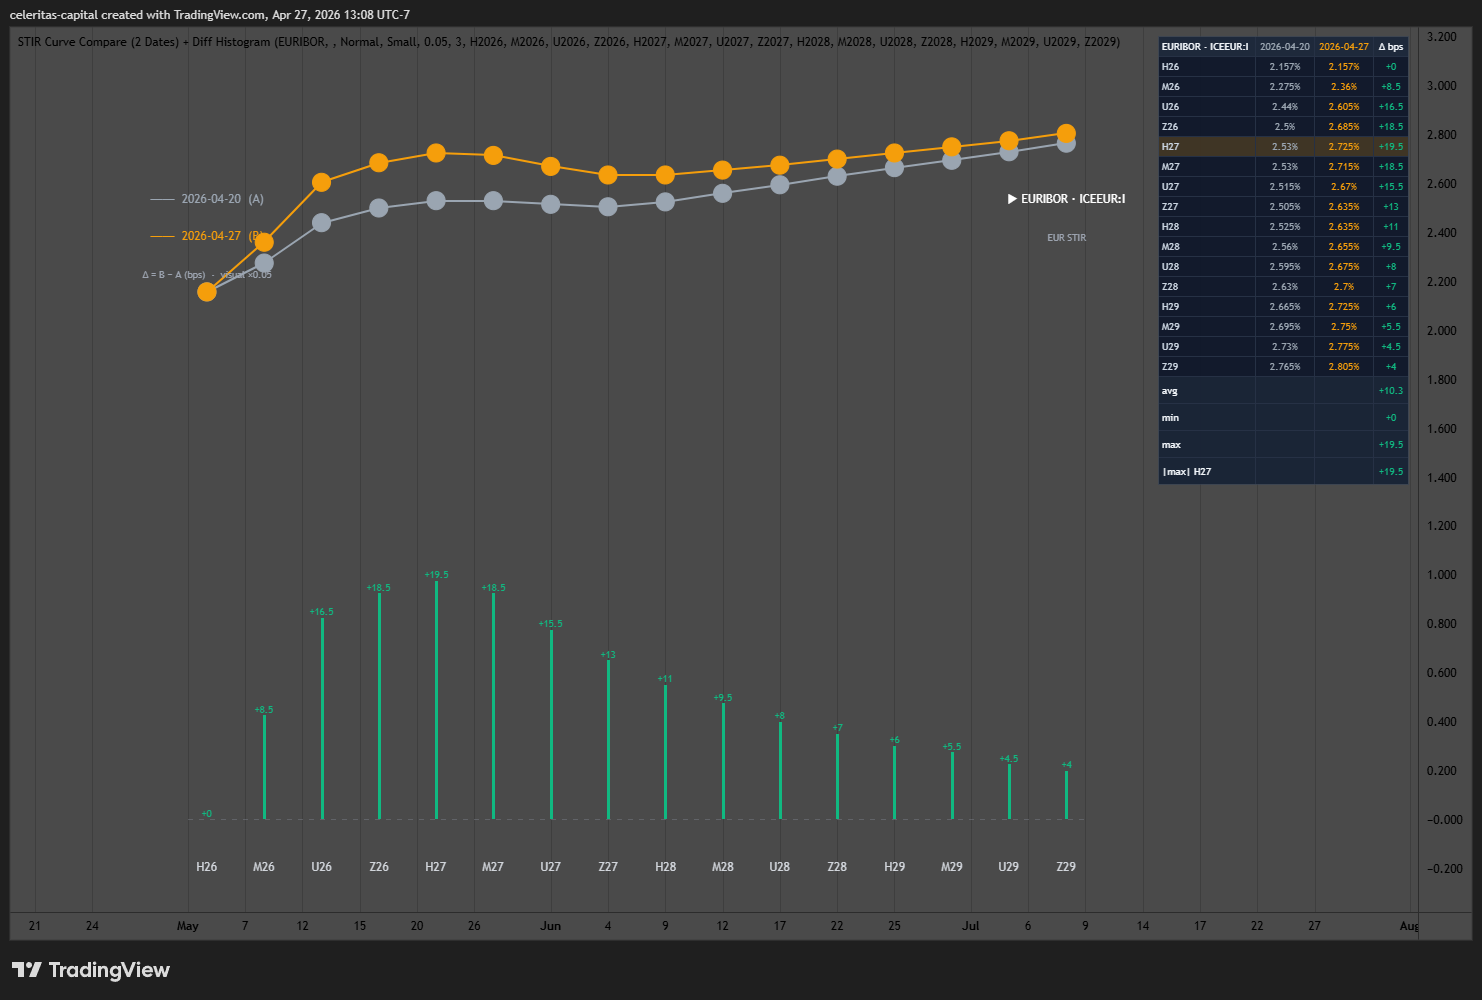
Just in the last 7 days the implied rate for ERM7 rose 18.5 bps which is a drop in the price of the future. (Figure 14) The EURIBOR curve is pricing in too many rate hikes currently. If they hike it will be a insurance hike in 2026 to lead the way for cuts in 2027 is my view at least.
What Validates the Trade: Pretty much the same as the SONIA trade. What Invalidates the Trade: Same as SONIA trade.
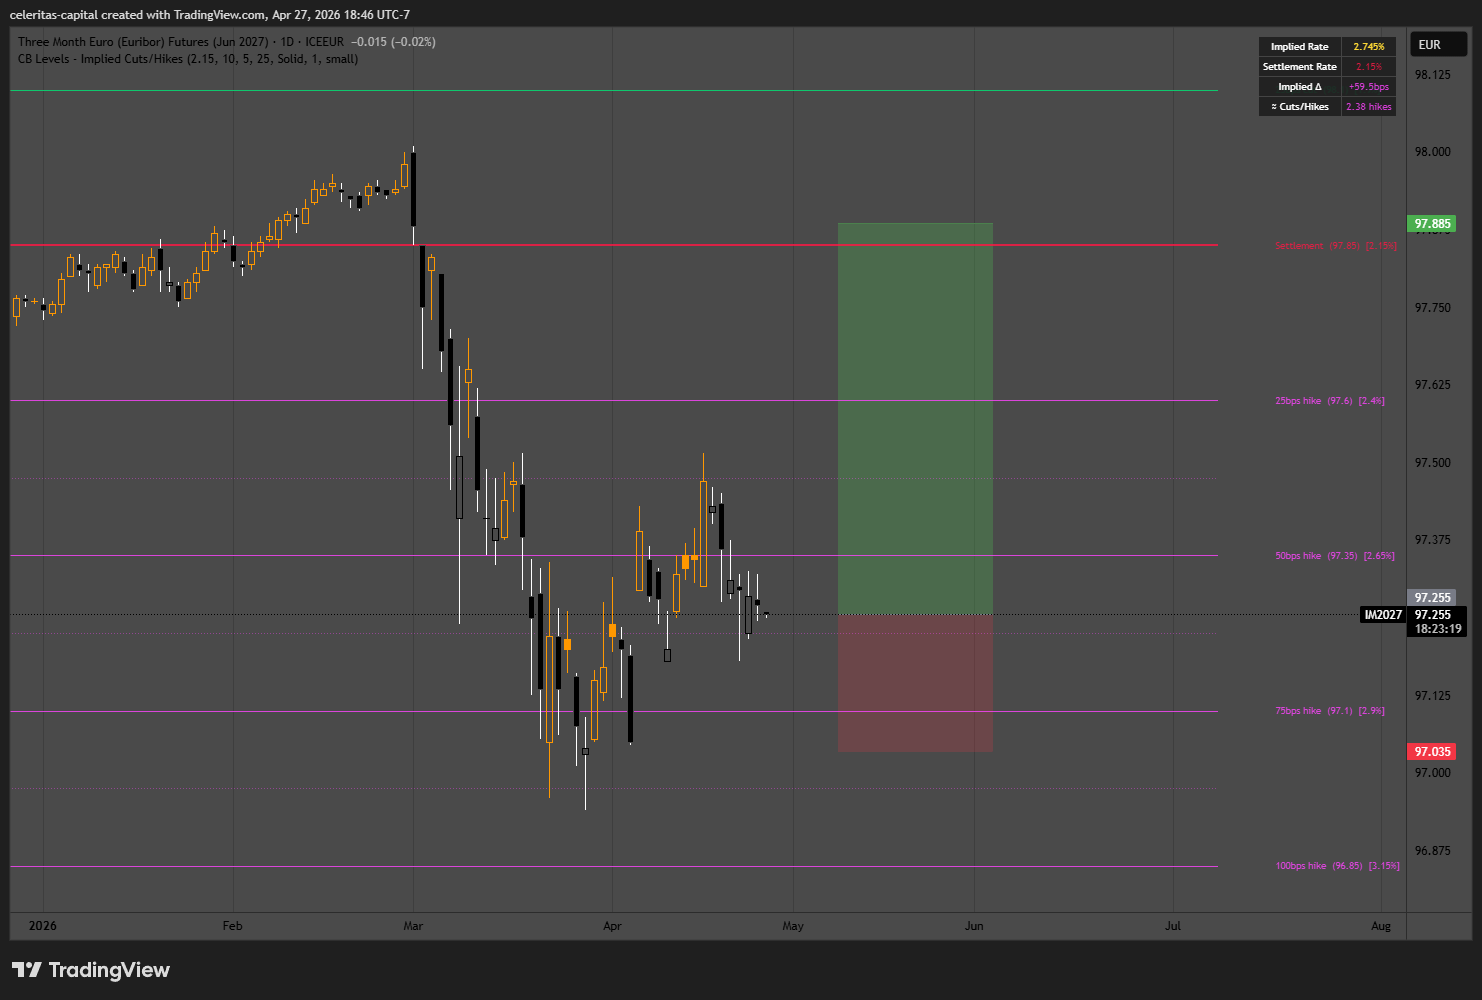
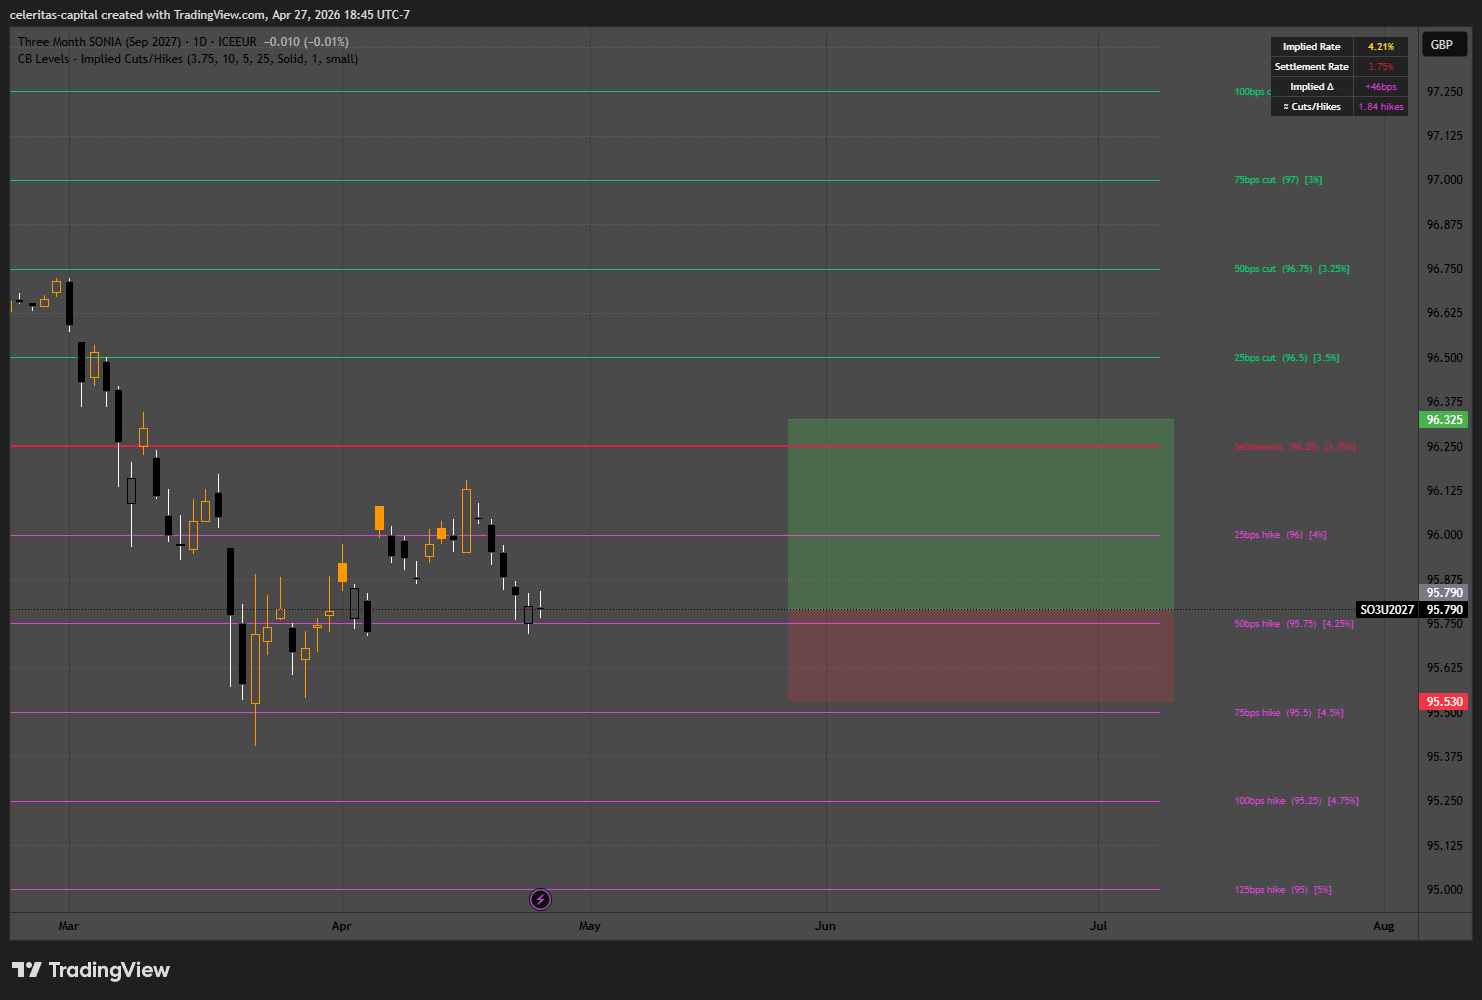
Below in Figure 15 & 16 is how I view the Risk:Reward on the trades currently. You could also configure this a butterfly shorting SFIZ26 x2 for every contract you long on the wings.
I have a new post in the works that is very interesting, I’m surprised I haven’t seen anyone talking about it. Coming soon!
Great piece