

Fixed Income Friday 9/1
Fixed Income Friday 9/1
The 2nd edition of Fixed Income Friday

Table of Contents
US Treasuries (UST)
Yield Curves
Corporate Bonds
High Yield
Asset Backed Securities (ABS)
USTs:
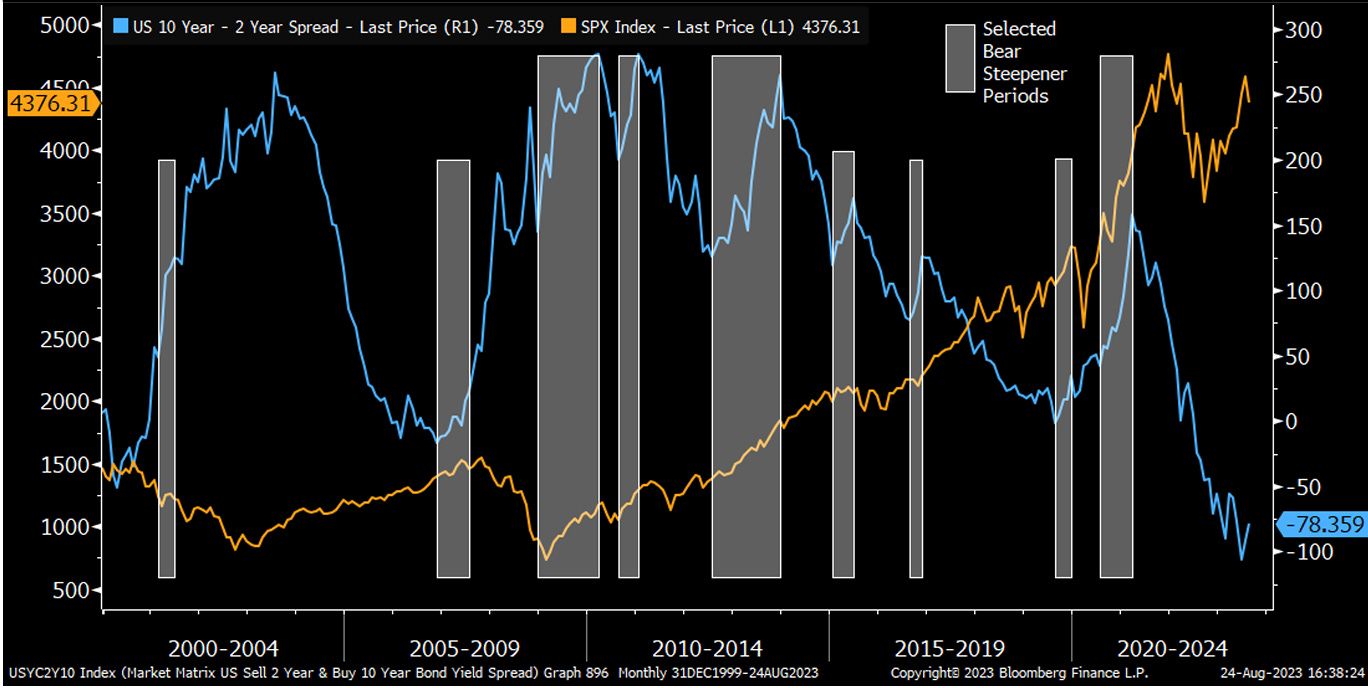
Bear Steepeners & SPX
The equity market has sold off around -1.7% since the US 10-Year to US 2-Year spread has widened 30 BPS since the end of June. Since the year 2000 there have been 9 other bear steepeners of at least 30 bps that lasted three months or more and in all but one case this was followed by an increase in the equity market. The average annualized return over the last nine bear steepeners was roughly 21.6%. The only time the equity market fell after a bear steepener of at least 30 bps that lasted three months was in 2001 from February through June which lead the equity market to fall by -1.3%. What does all of this mean in simple terms? Bear steepeners like the one we are currently experiencing have historically coincided with equity market rallies. Figure 1 below shows this correlation.
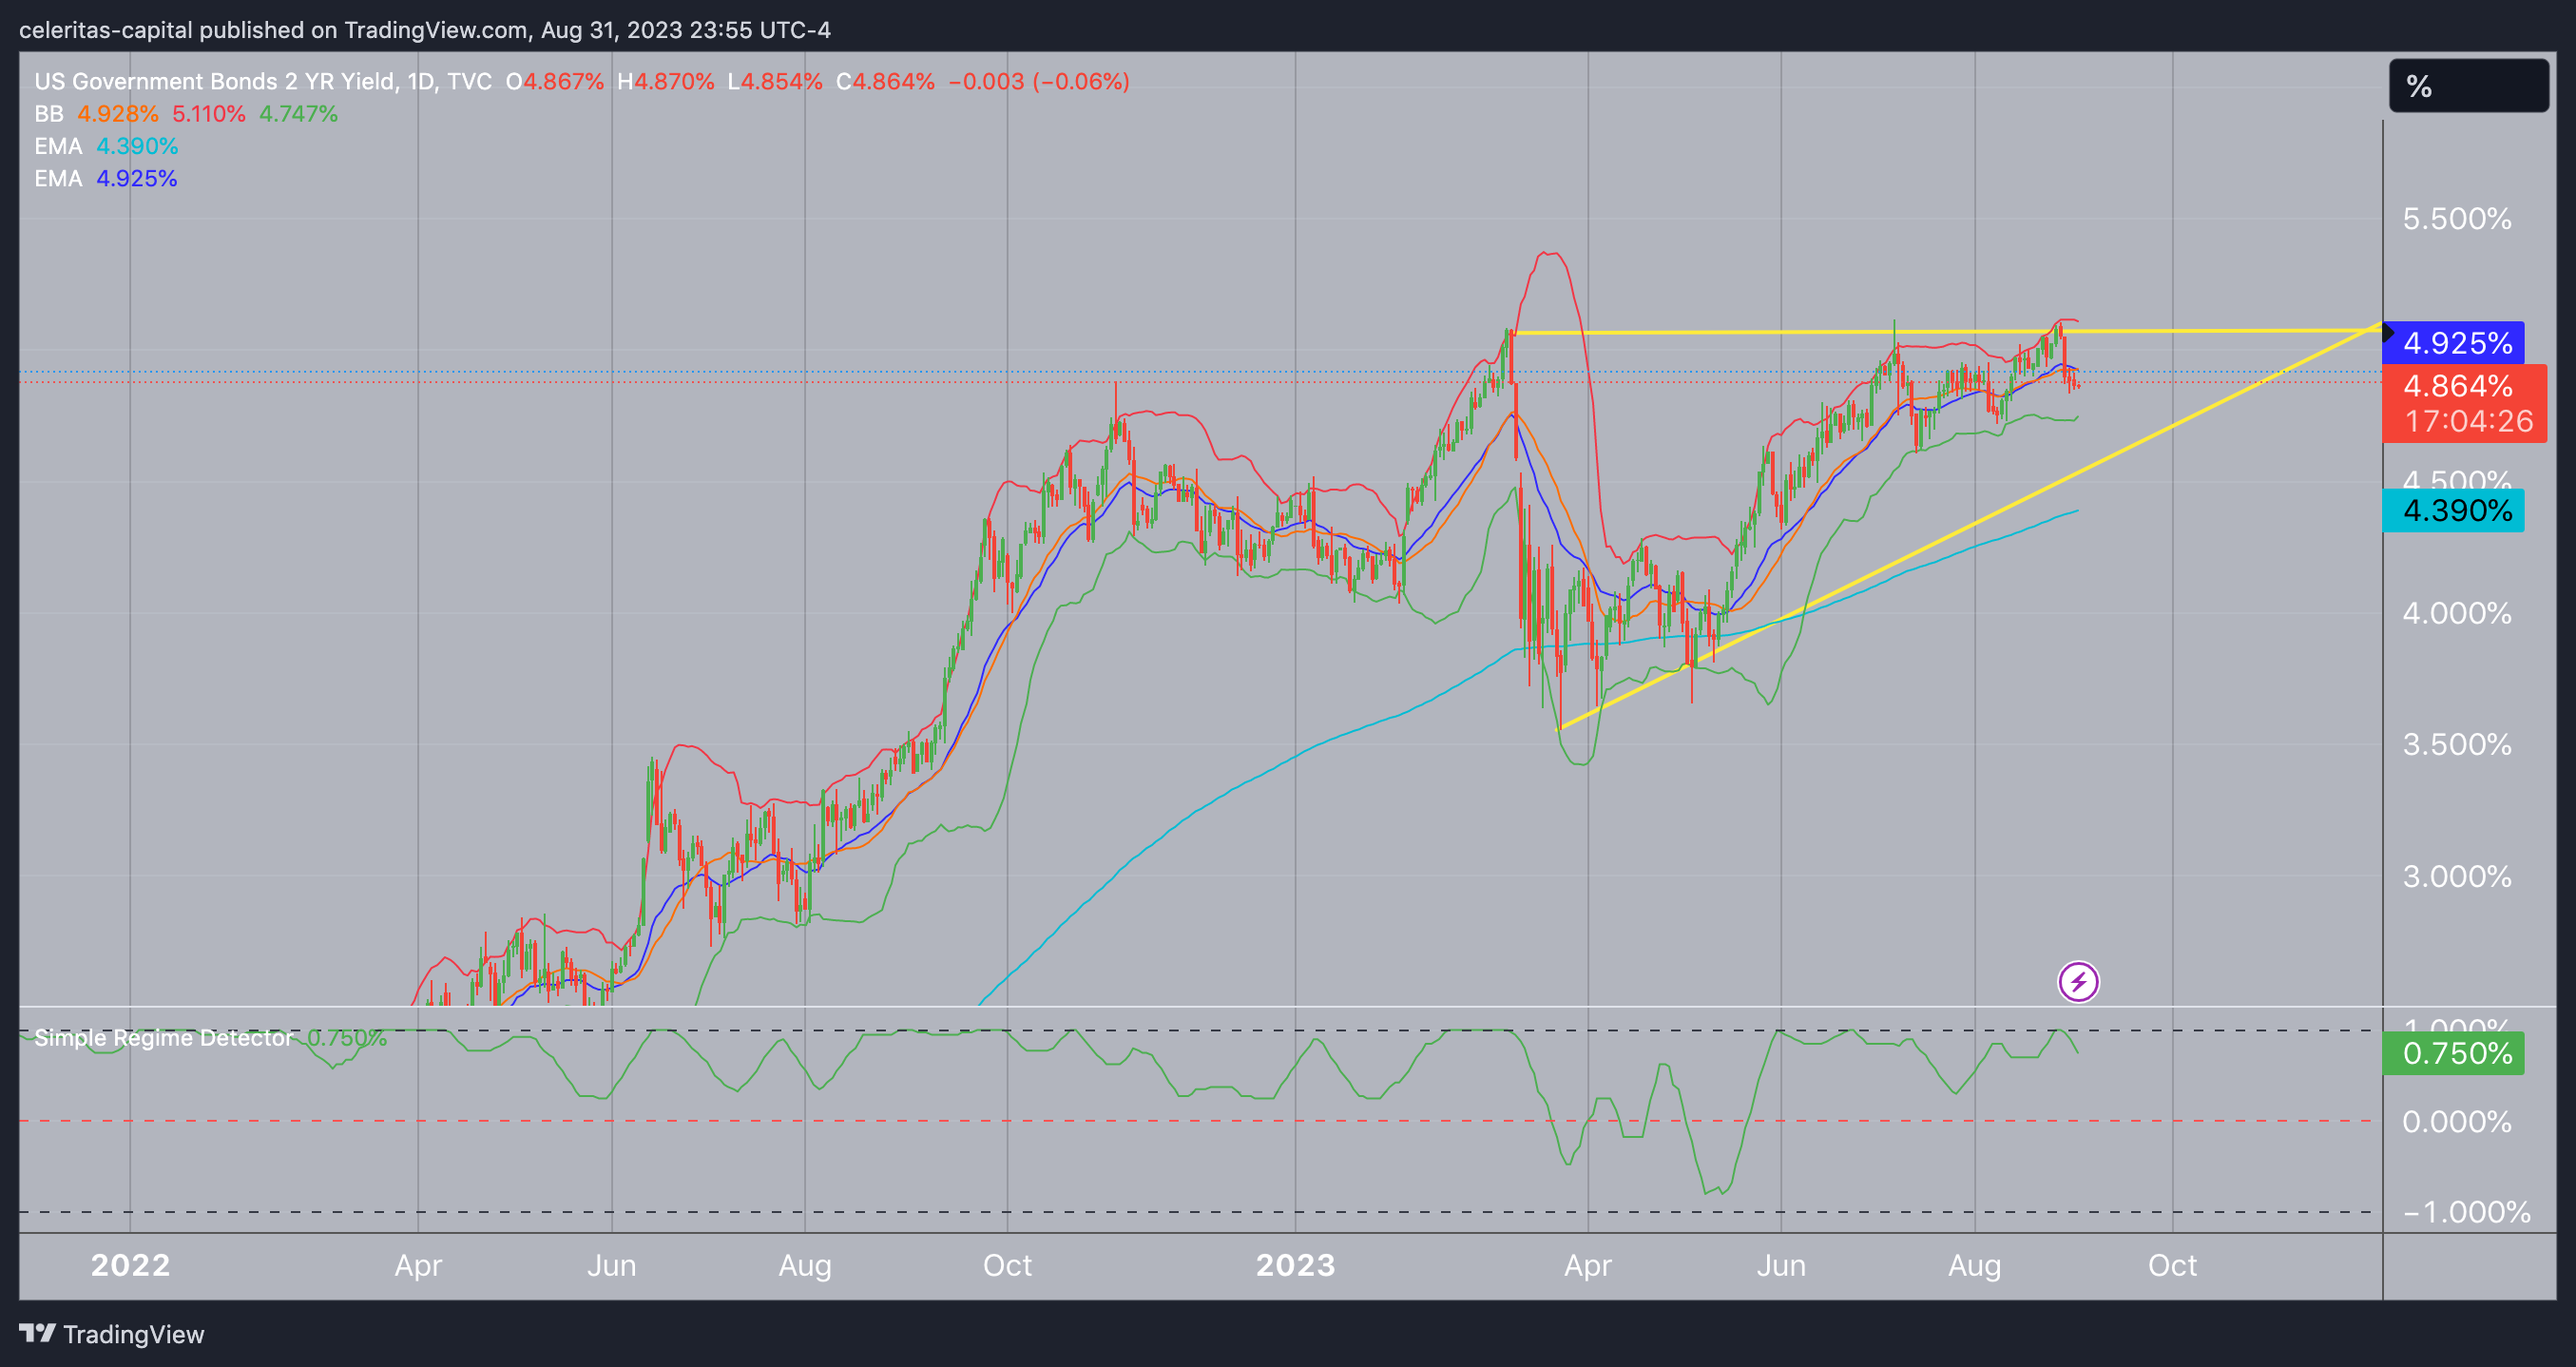
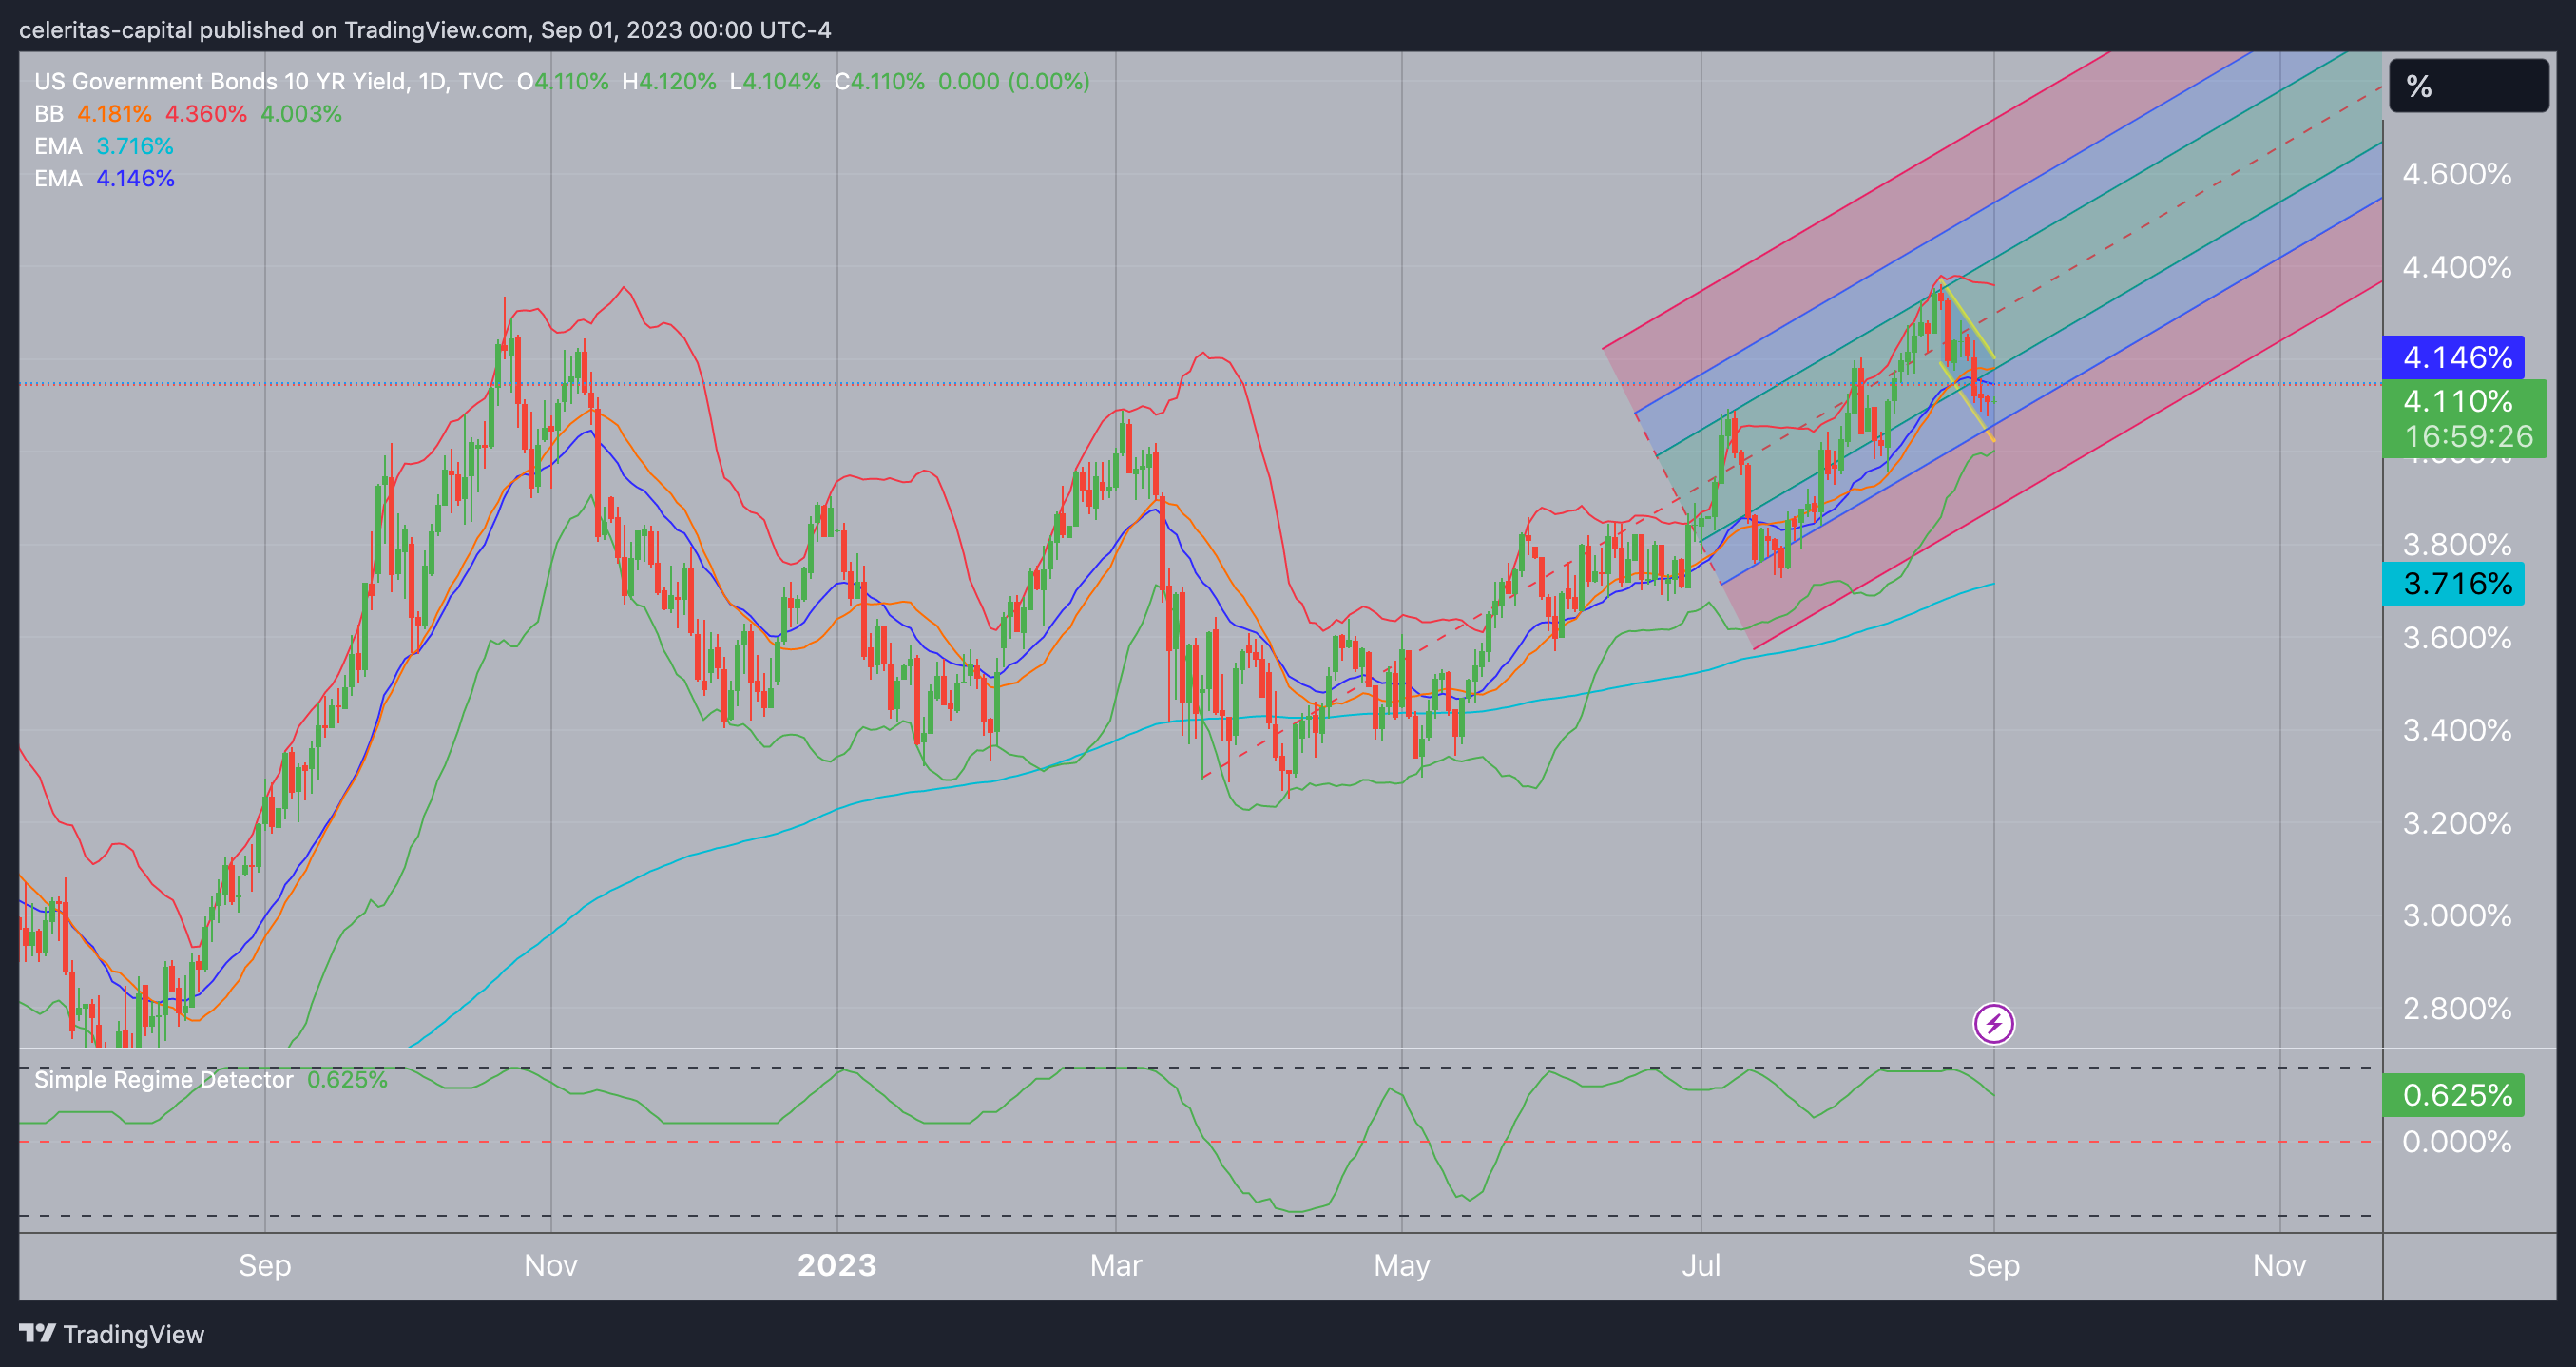
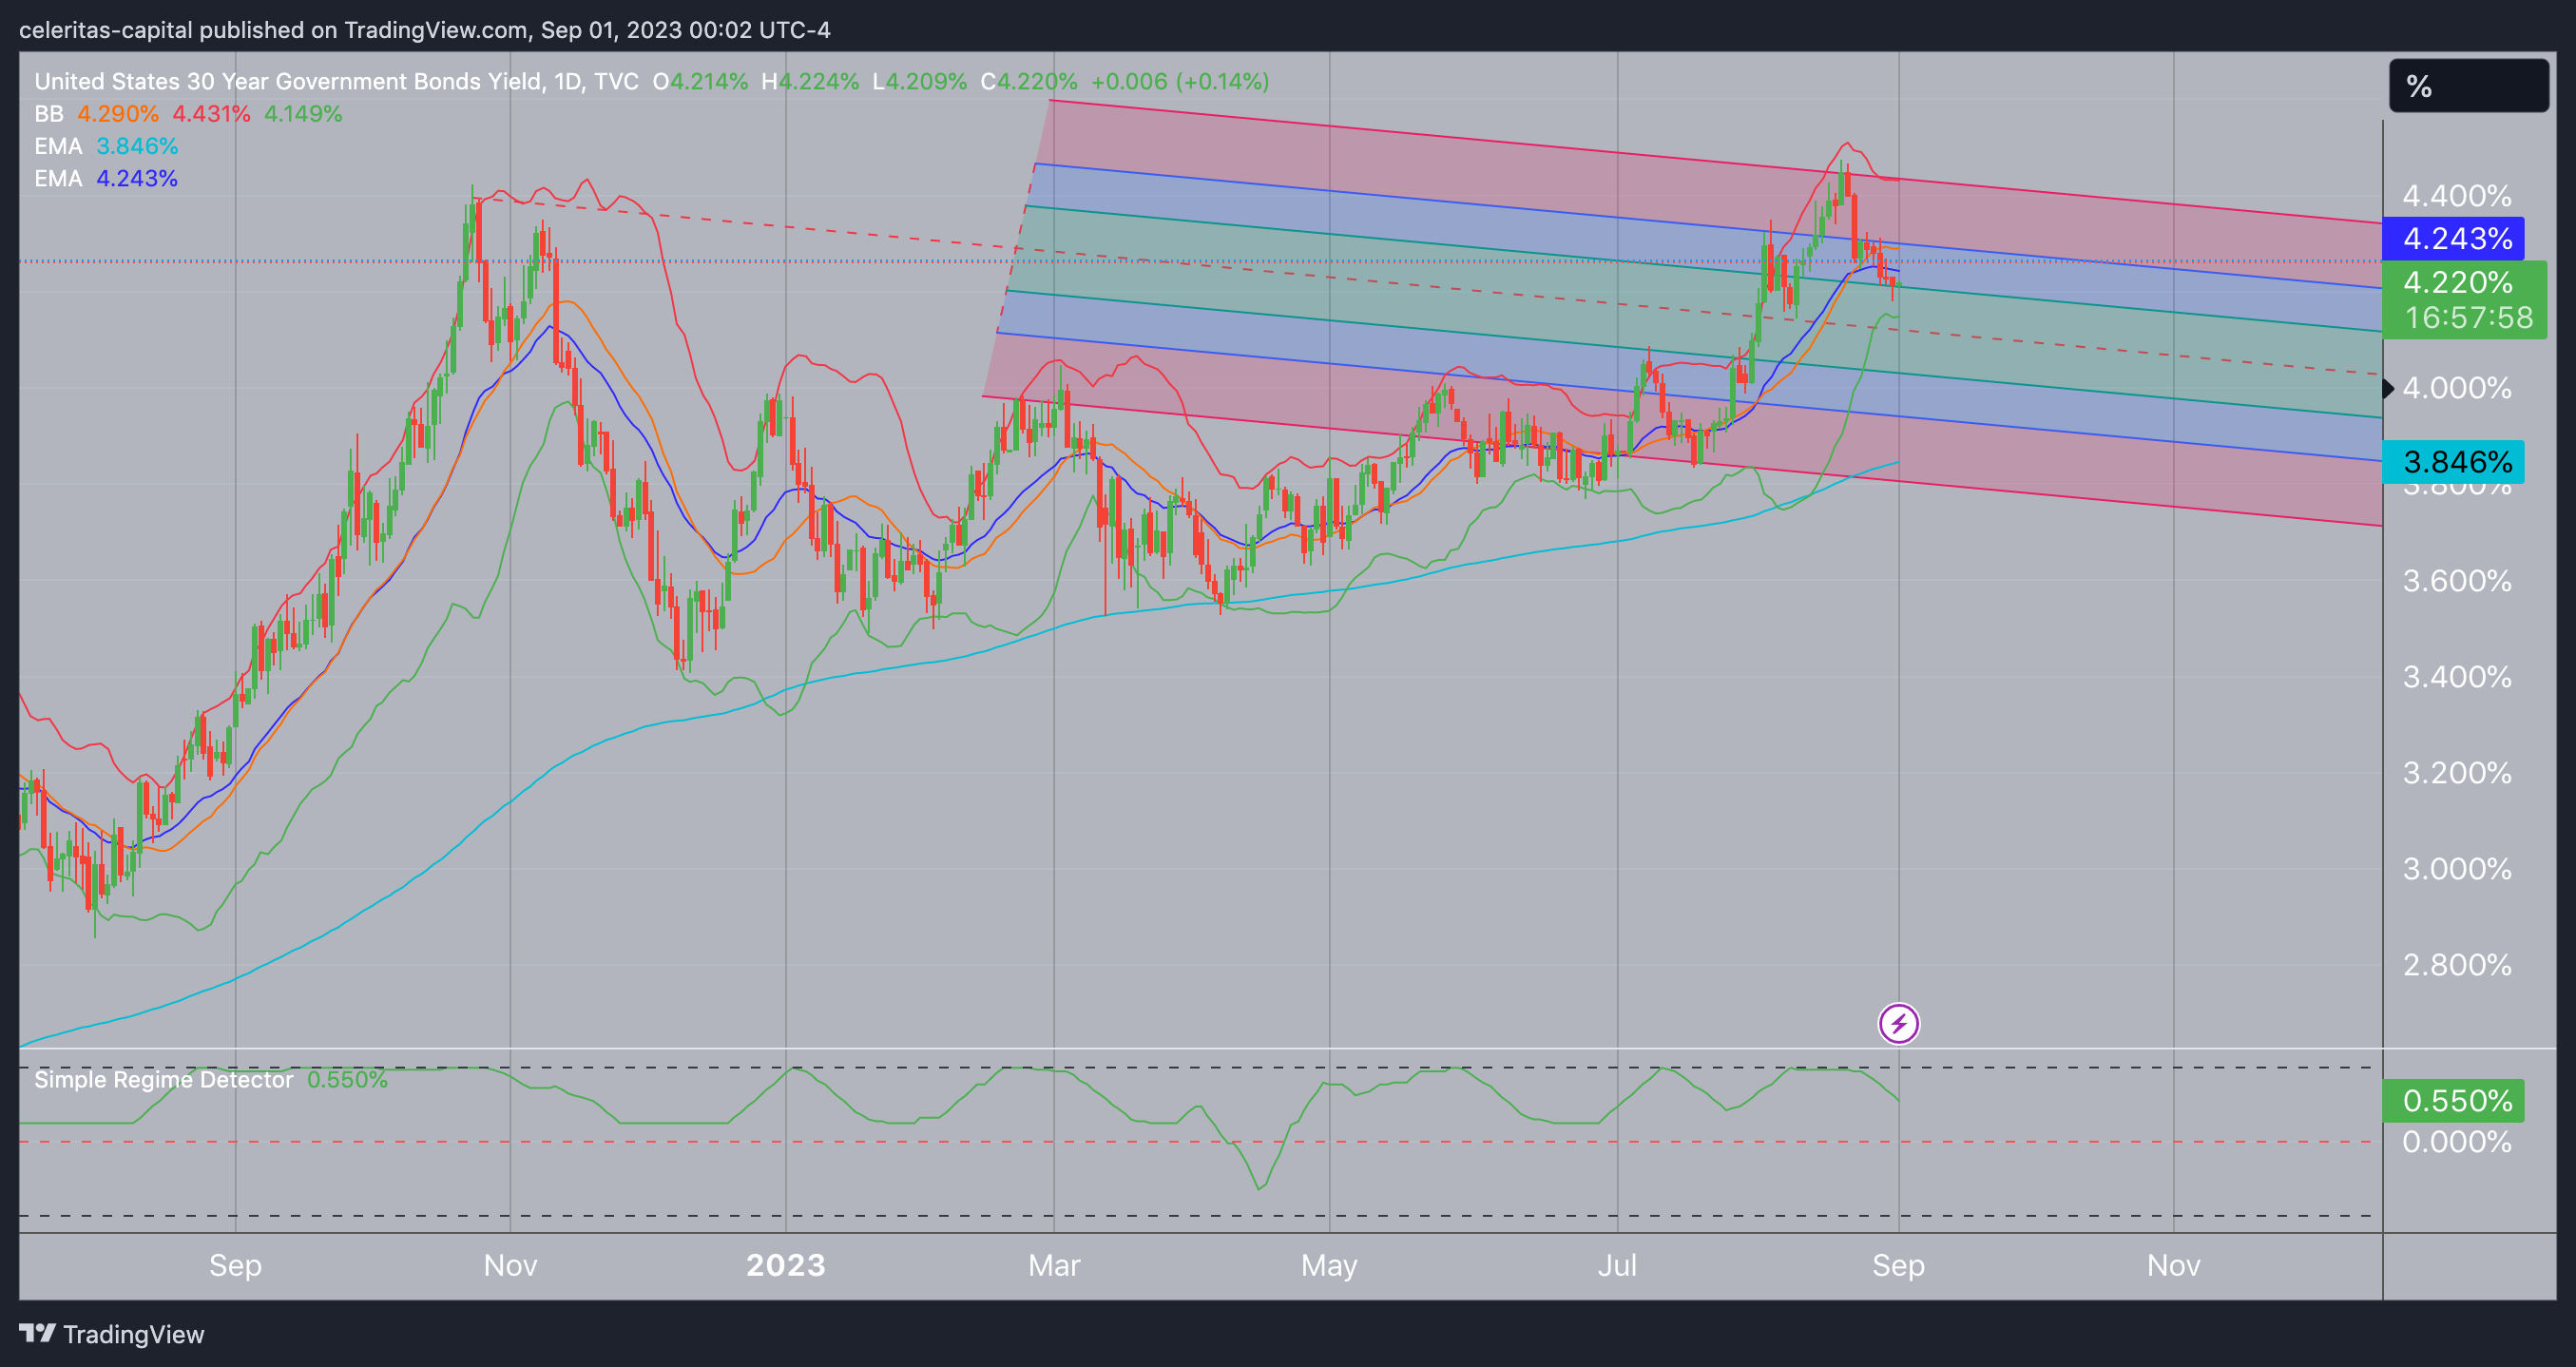
UST Yield TA
Key- Bollinger Bands Upper Bound=Red, Lower Bound=Green, basis=orange. Light blue line is 200d EMA & purple line is 21d EMA.
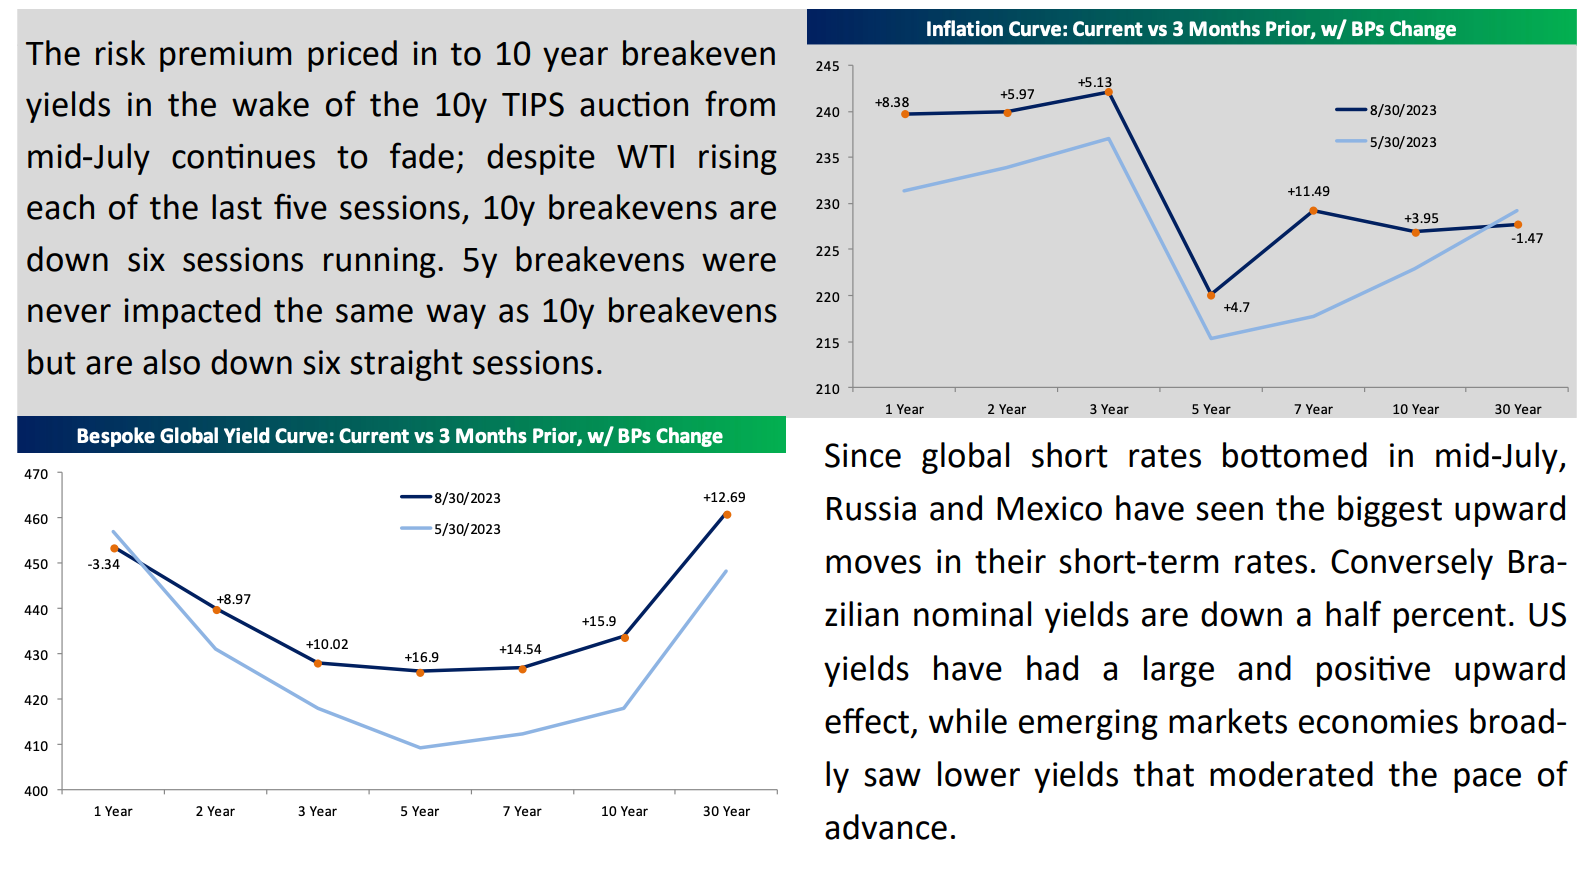
Yield Curves:
Corporate Bonds:
High Yield-
Fallen Angels and the B’s
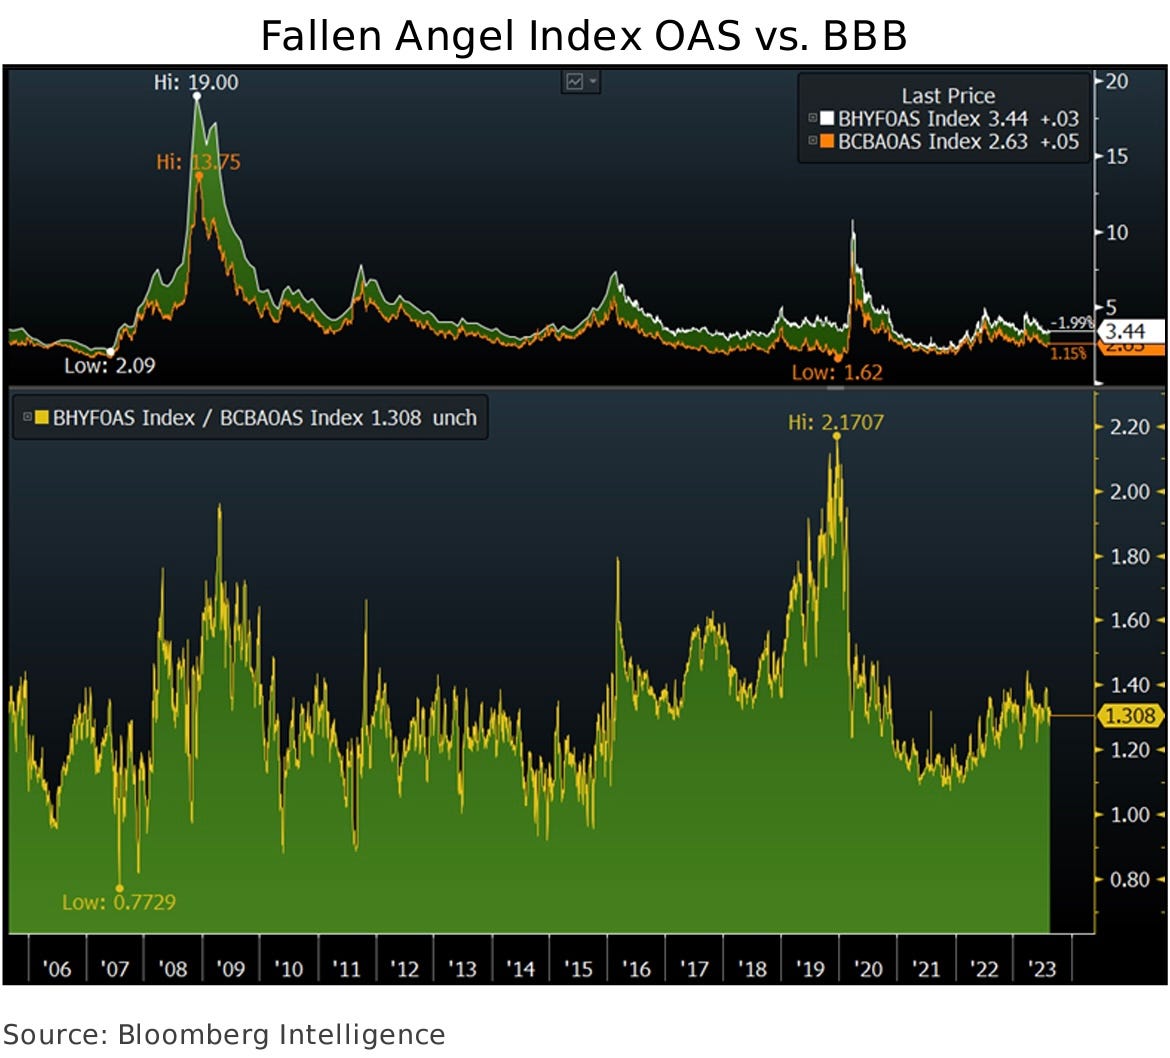
The Bloomberg U.S. High Yield Fallen Angel 3% Cap Total Return Index. Is made up of Fallen Angel bonds, these bonds once had the investment grade rating but have been downgraded to high yield.
The Option-adjusted spread (OAS) for the Bloomberg U.S. High Yield Fallen Angel 3% Cap Total Return Index is currently closely aligned with long-term norms in comparison to BB rated debt. The ratio stands at 1.31x as of 8/25 which is in line with the average ratio of 1.32x observed since 2005. With the fair valuation of fallen angels compared to BBs, I suspect a period of relatively weaker performance in the near to medium term. Considering my perspective on an extended phase of credit stress and distress, I expect the ratio to adjust towards the more typical range of 1.6-1.8x, which is commonly associated with cycle peaks. Which I believe we are nearing.
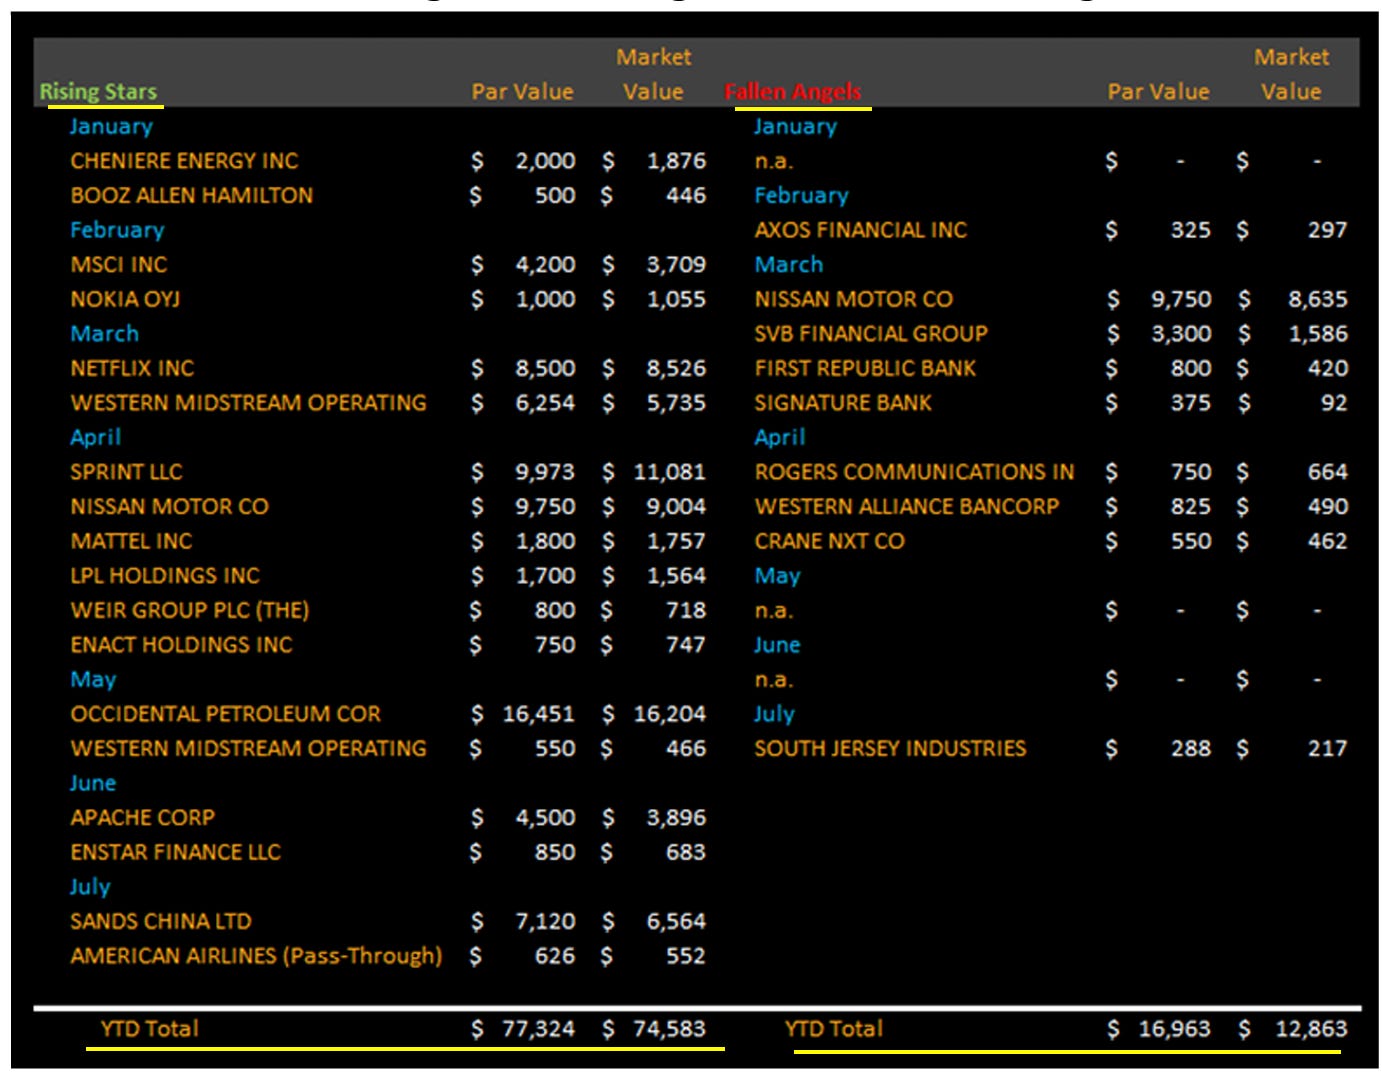
First Energy FE 0.00%↑ & Las Vegas Sands LVS 0.00%↑ are currently on the Bloomberg Rising-star prospects. This is due to the current credit ratings and outlooks for both companies. With FE 0.00%↑ and LVS 0.00%↑ and other Rising stars outperforming the rest of the Fallen Angels Index.
Investment Grade-
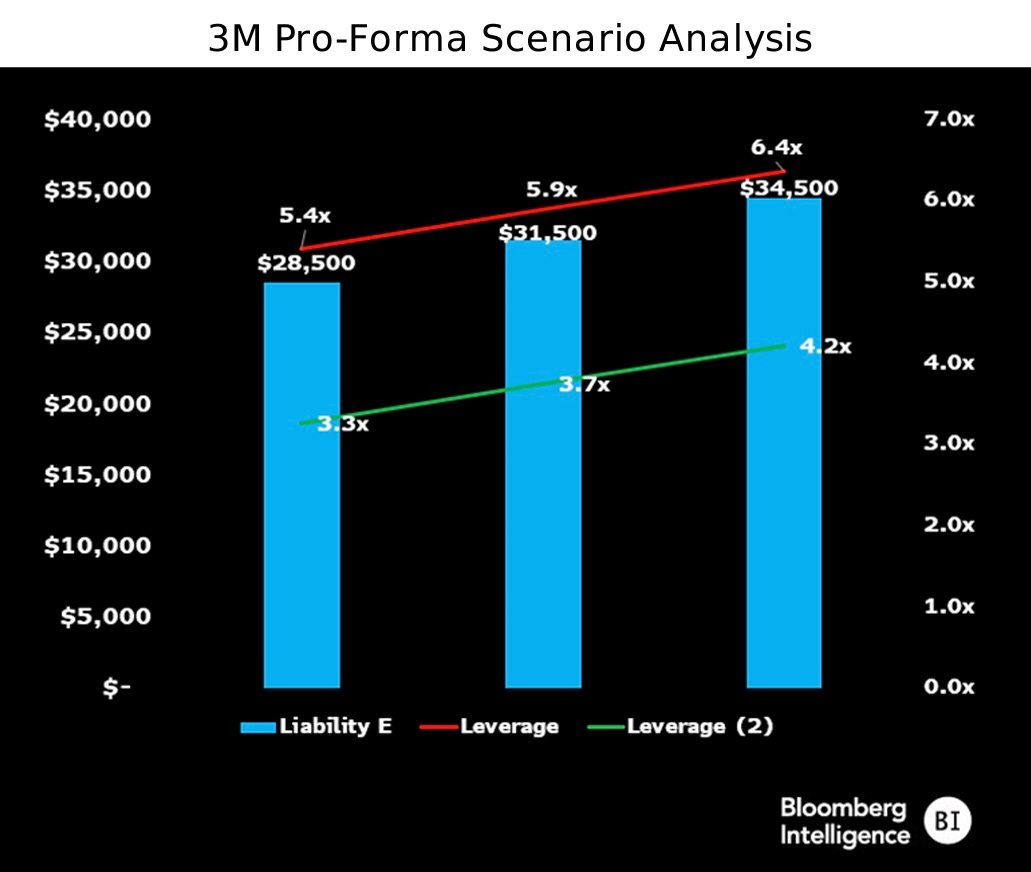
On 8/30 MMM 0.00%↑ was downgraded by S&P to BBB+ However, the downgrades may not be over yet. With MMM 0.00%↑’s $5.5 billion dollar lawsuit over military earplugs ending one might see this as a positive but rating agencies have yet to fully add this to their rating models.
In a scenario where 3M's earplug and PFAS liabilities reach the upper end of Bloomberg Intelligence Litigation's targets and credit rating agencies fully integrate this risk into their credit metrics, 3M's estimated adjusted leverage for 2024 increases to 6.4x (or 4.2x net basis). In a more optimistic scenario, assuming 3M utilizes a 3.25x leverage on its health-care unit and allocates dividends, along with its 19.9% remaining stake in the unit post-spinoff, to reduce its liabilities, the best-case scenario projects a leverage of 3.4x. In a mid-range scenario with reduced health-care-related risk, the pro-forma net leverage hovers around 3.7x (almost 6x gross). Notably, during a similar period of heightened risk, GE's ratings were downgraded to their current level (Baa1/BBB+/BBB).
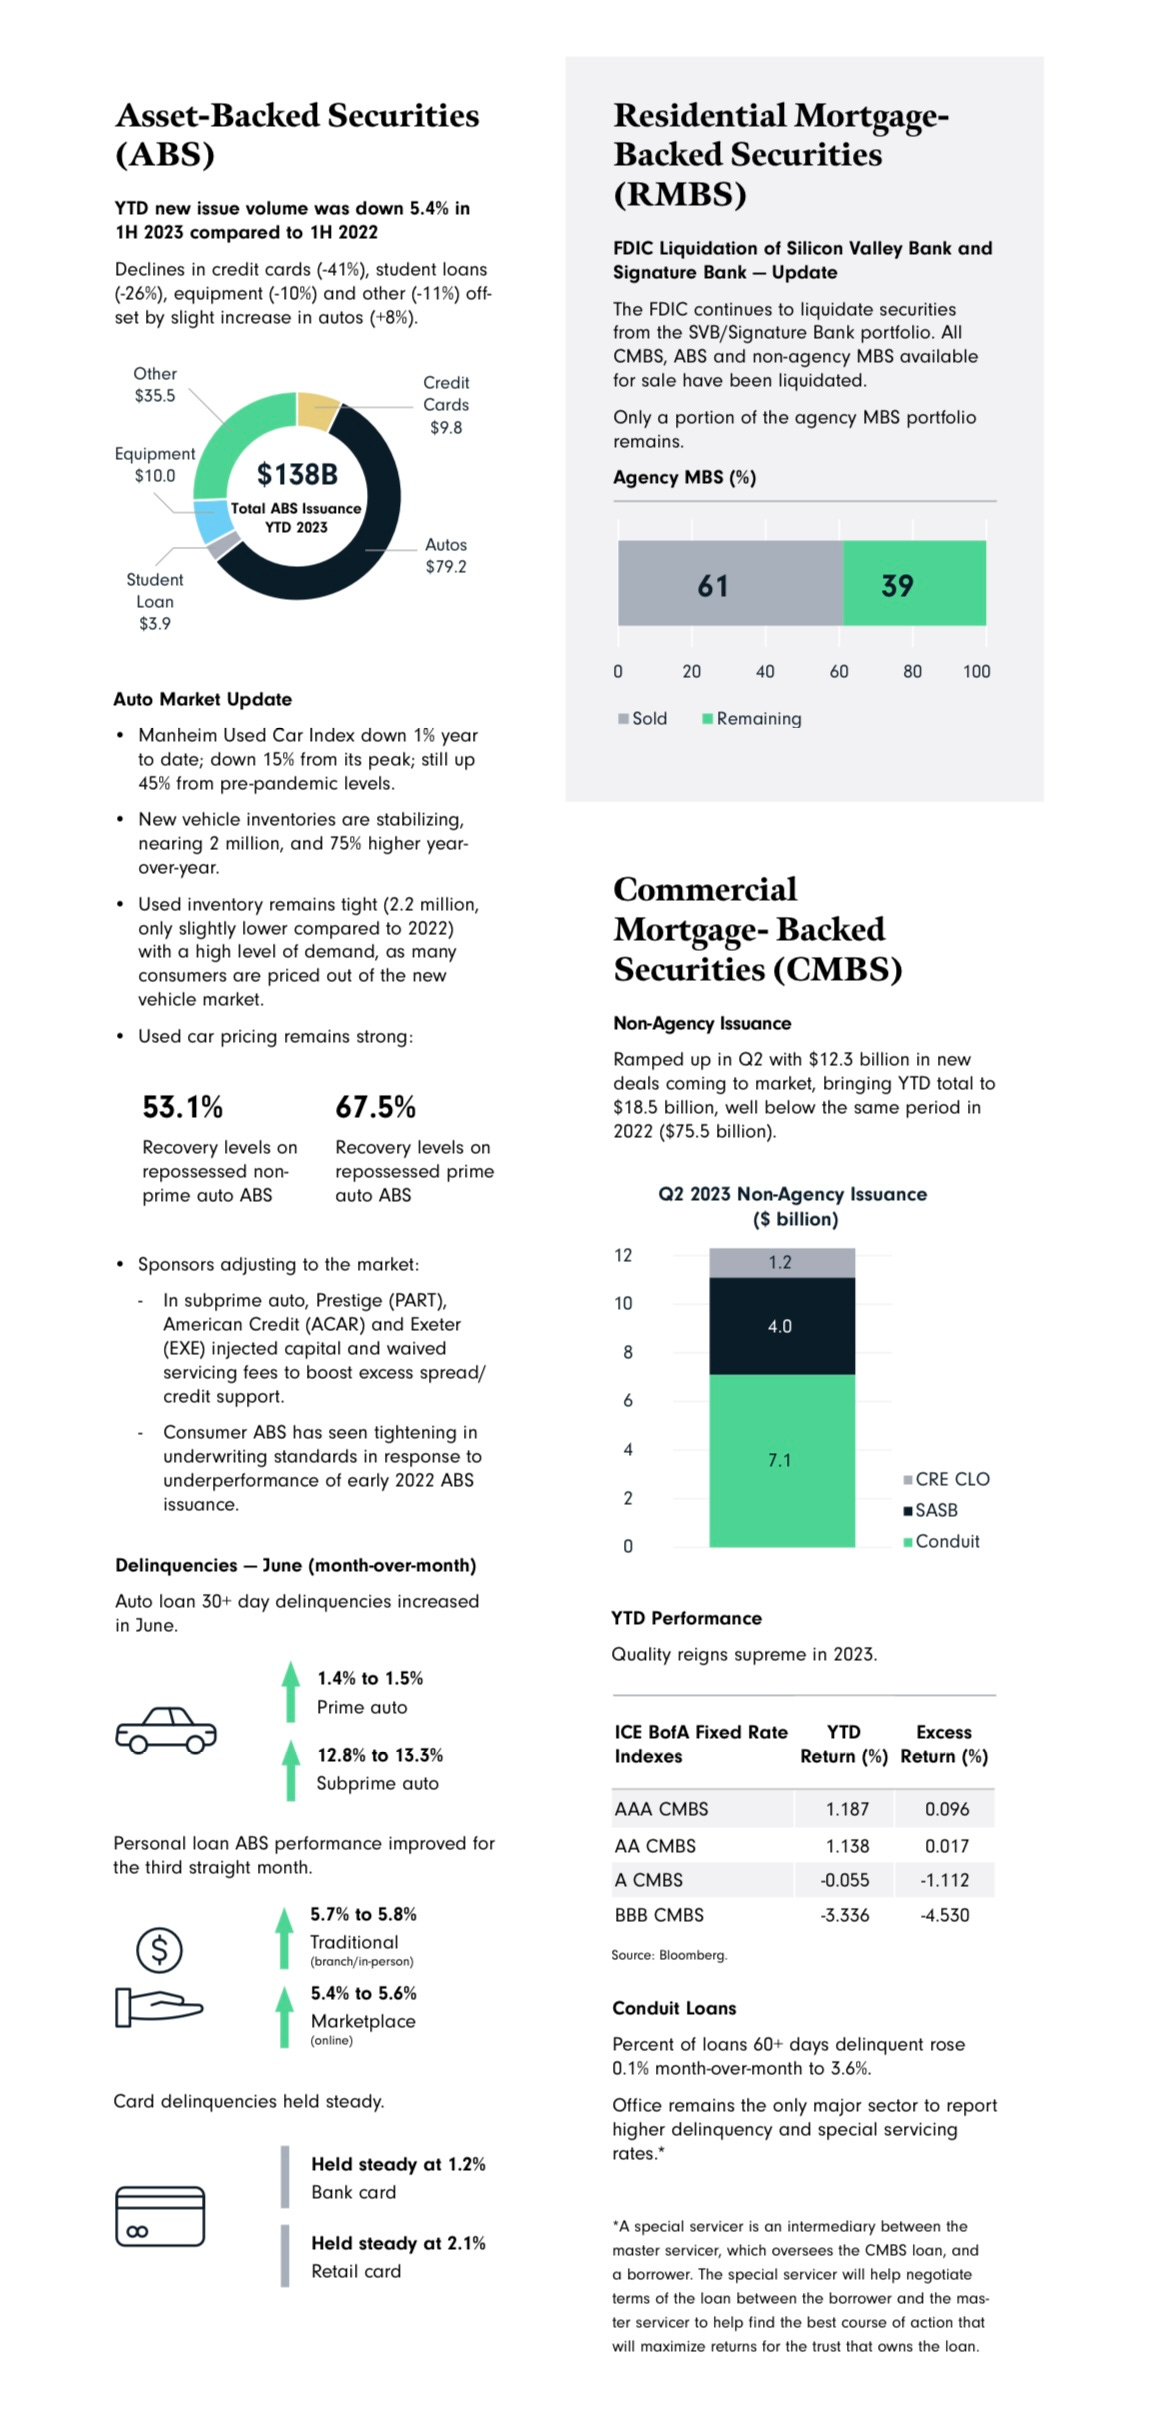
ABS:
Finally I have included a graphic with some information on the ABS industry. I hope you enjoyed this weeks Fixed Income Friday as always feedback is welcomed in the comments! Thank you for reading and all of the continued support.
DISCLAIMER: We are not Financial Advisors, and all information presented is for educational purposes ONLY. Financial markets can be highly volatile, so good risk management is a must.
great coverage, thank you!