Table of Contents
US Treasuries (UST)
Yield Curves
Corporate Bonds
Conclusion
USTs:
Good evening, afternoon or morning depending on where you are reading from! Since the last time I wrote an update on the fixed income world things have changed. I honestly I’m not sure where to start, so lets start with a classic taking a look at the TA for UST yields.
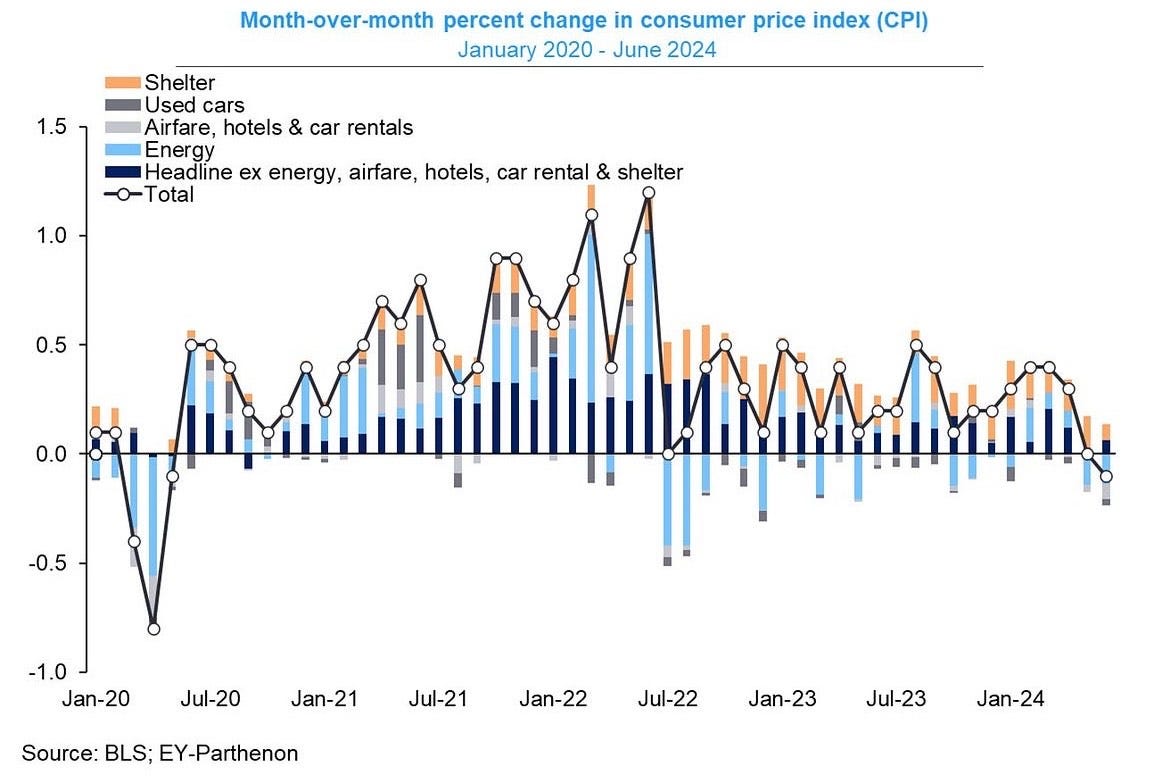
To begin lets take a look at the US 02Y UST yield. As shows the US 02Y is below the 21, 50 and 200 day EMA’s. (Figure 1) After CPI last Thursday short end duration yields have been dropping.
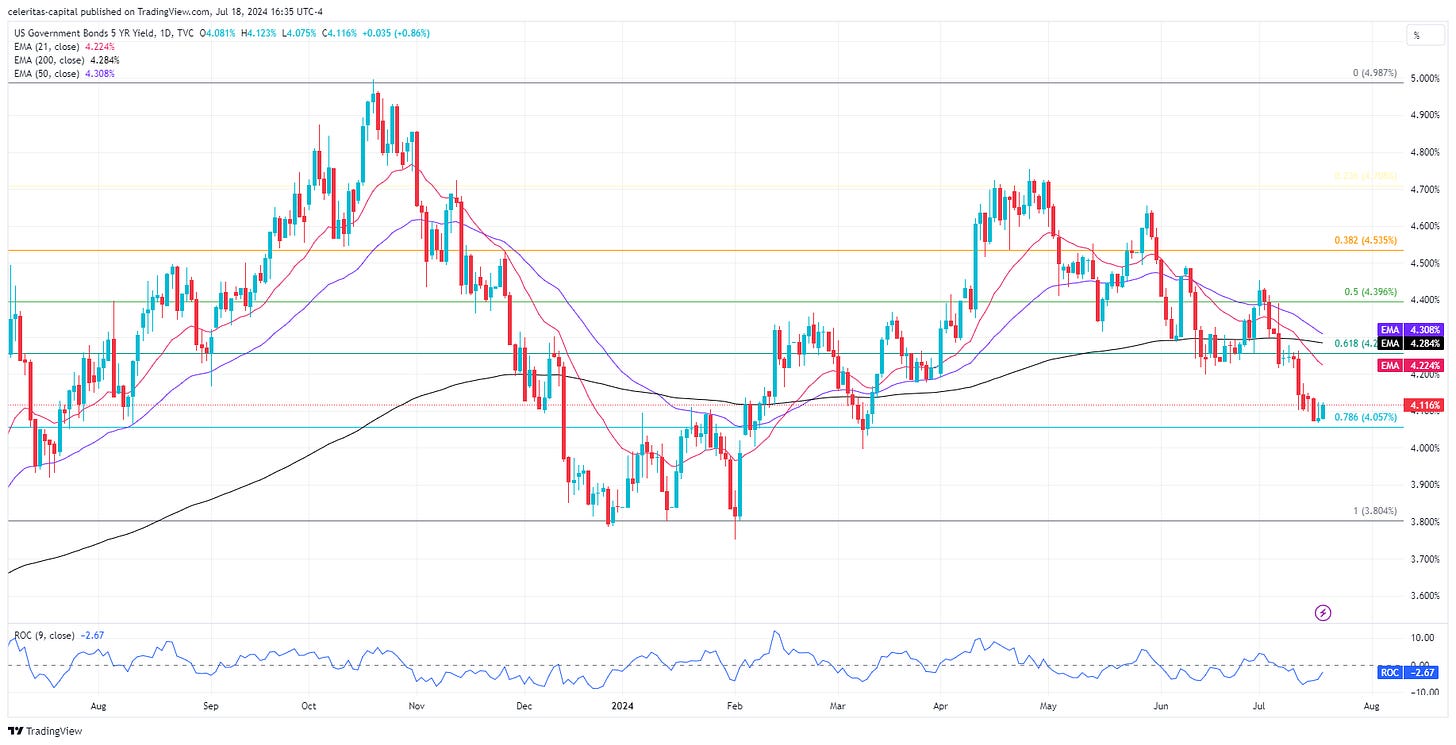
Next we will look at the US 05Y which also got hit hard by last weeks CPI print. (Figure 3) The 5Y yield is also trading below the major EMA’s. I predict we will see a test of the 0.786 Fibonacci level. From there I see two possible outcomes. First if we lose the 0.786 level I think we see the US 05Y trade near the 4% area. The second possibility I see is a bounce off the 0.786 level with the US 05Y then trading in a range with the upper limit being the 0.618 Fibonacci level and the lower limit being the 0.786 Fibonacci level. (Figure 3) I would expect that range until the upcoming FOMC meeting.
The US 10Y again was pushed down by last Thursday’s CPI report. Quick note the orange horizontal lines are key levels, the red horizontal are resistance levels and the green horizontal lines are support levels. With that being said I expect the US 10Y to test the 200d EMA (black line) in the coming sessions. (Figure 4)
Finally, we will take a quick look at the US 30Y yield. Again last Thursdays CPI report dropped the US 30Y yield below its 200d EMA. But from a technical view I think that the US 30Y yield is the most bullish out of the UST charts we have looked at. Today (Thursday the 18th of July 2024) the US 30Y tested and failed to break its 200d EMA. (Figure 5) However, it looks ready to re-test the 200d EMA in the next couple of sessions.
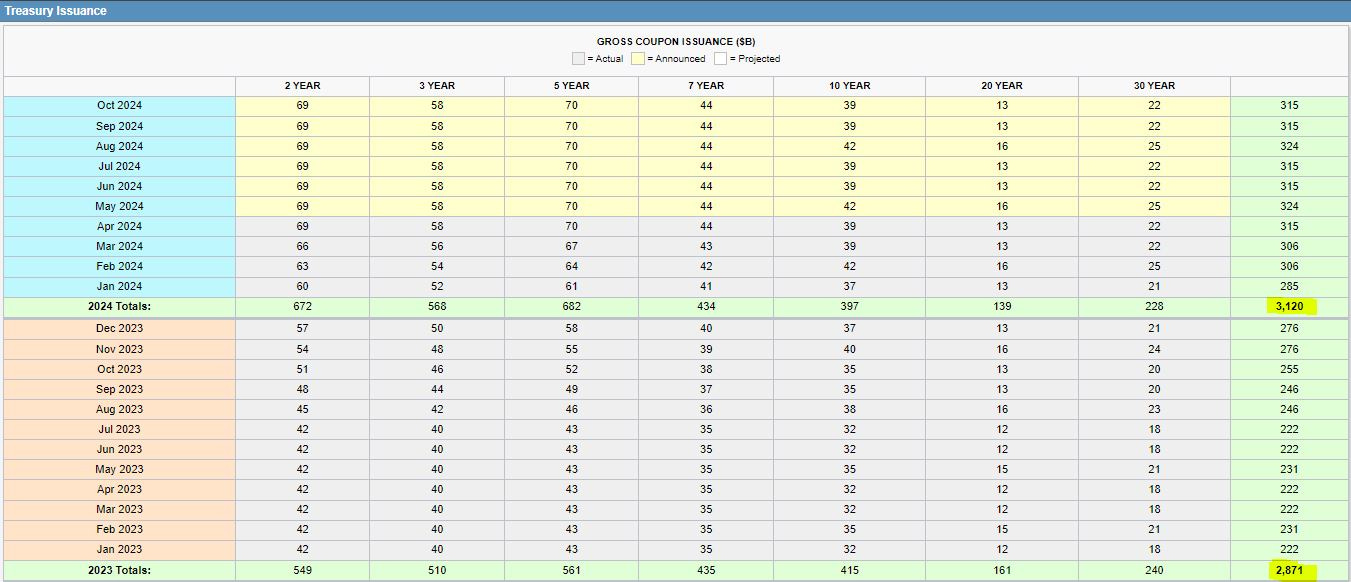
Now lets take a look at the rest of the years Treasury Issuances. (Figure 6)
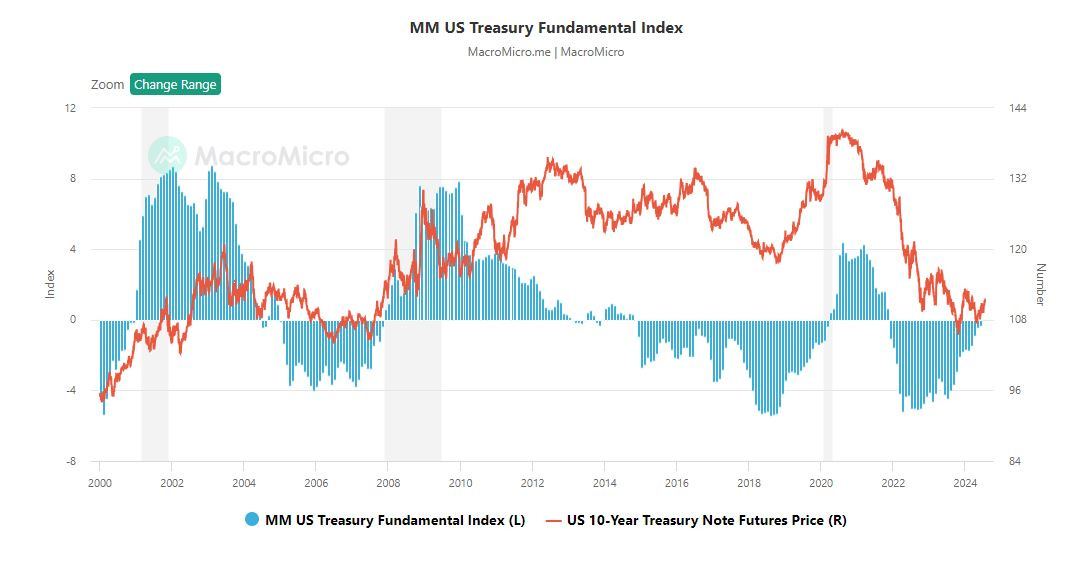
The MM Fundamental Index (MMFI) for US Treasury bonds is a comprehensive index developed by MacroMicro to evaluate the fundamentals of US Treasury securities. An increase in the index suggests improving fundamentals for US bonds. (Figure 7)
The MMFI consists of various components, including US Treasury auction results, the US core Consumer Price Index (CPI), and the US Treasury Note Commitment of Traders (COT) Index, among others. The weighting of each component is adjusted based on current bond market conditions.
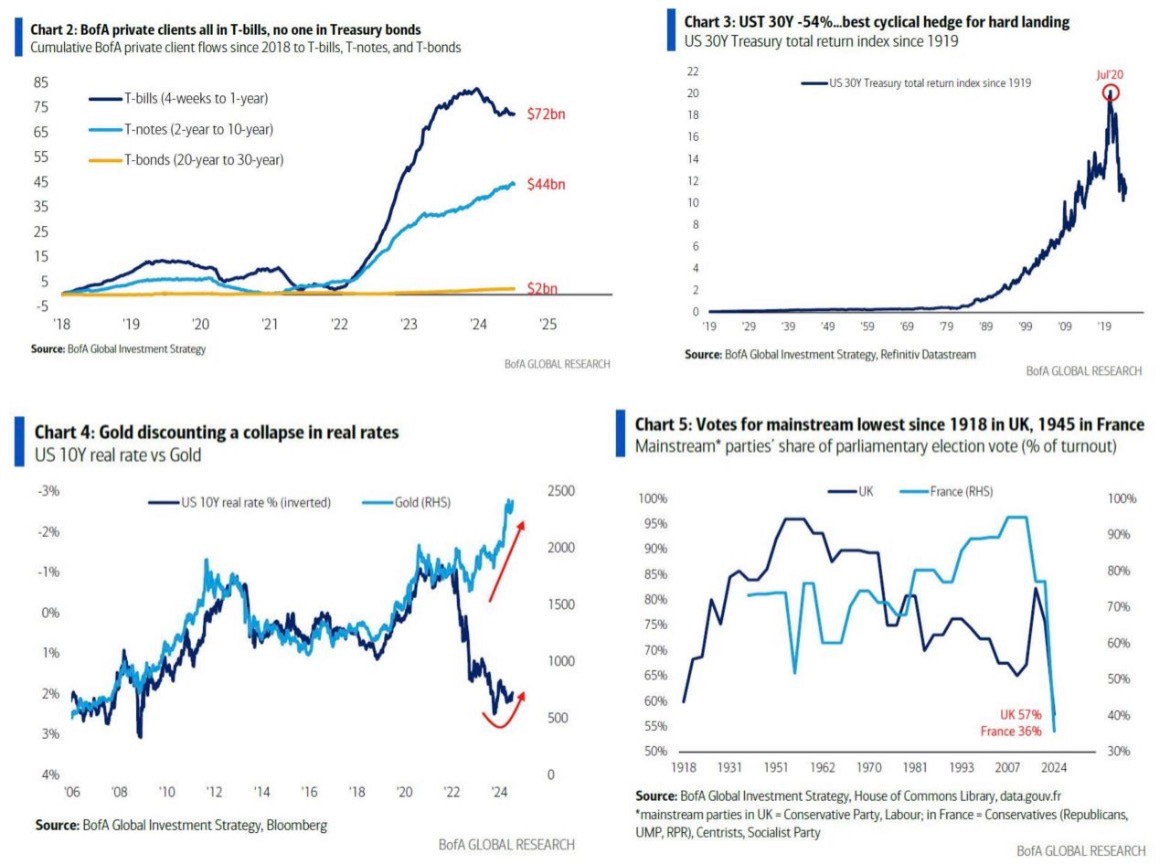
It would also appear that market participants are still pilling into T-bills when compared to T-bonds which have seen little growth. T-notes appear to be growing slightly, according to BofA in Figure 8 chart 2. (Figure 8)
Yield Curves:
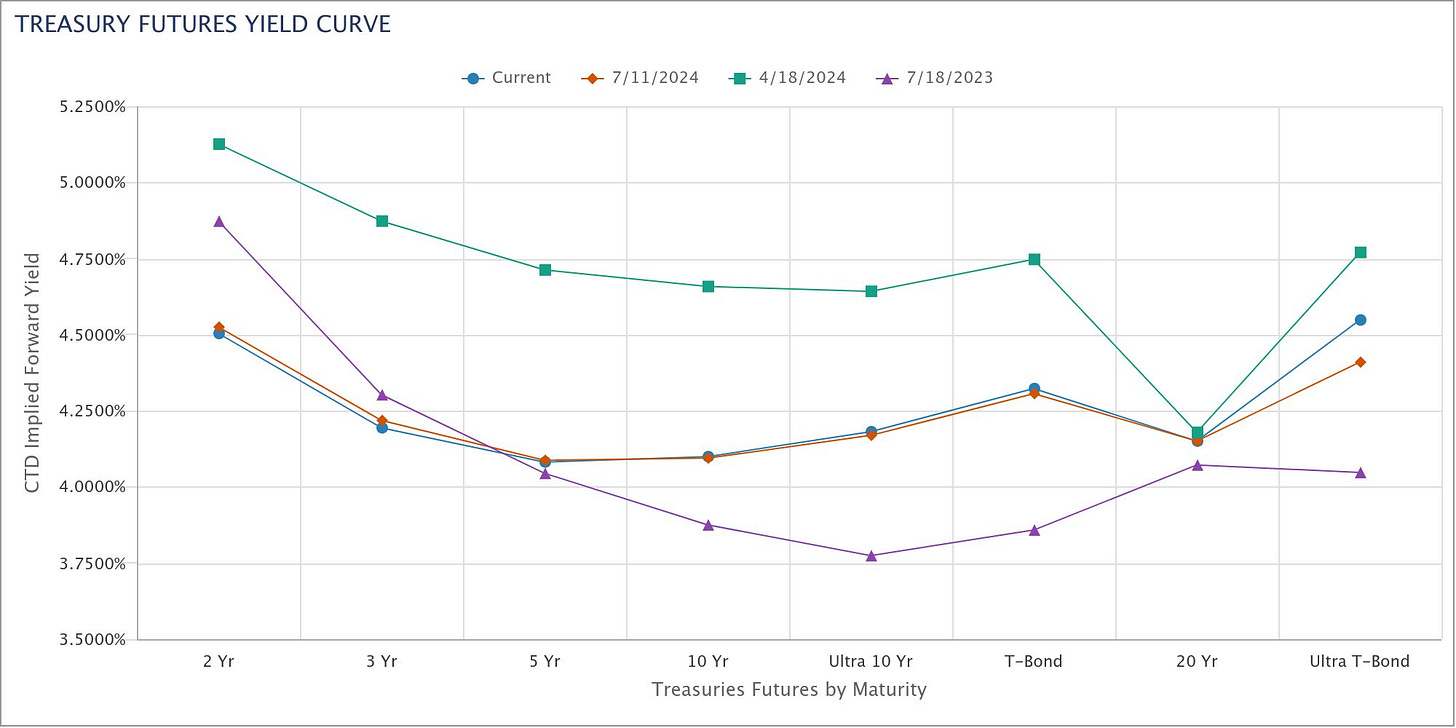
Figure 9 shows the current UST futures yield curve compared to several moments over the past year. In my opinion it looks like the curve pretty far into its correction. (Figure 9)
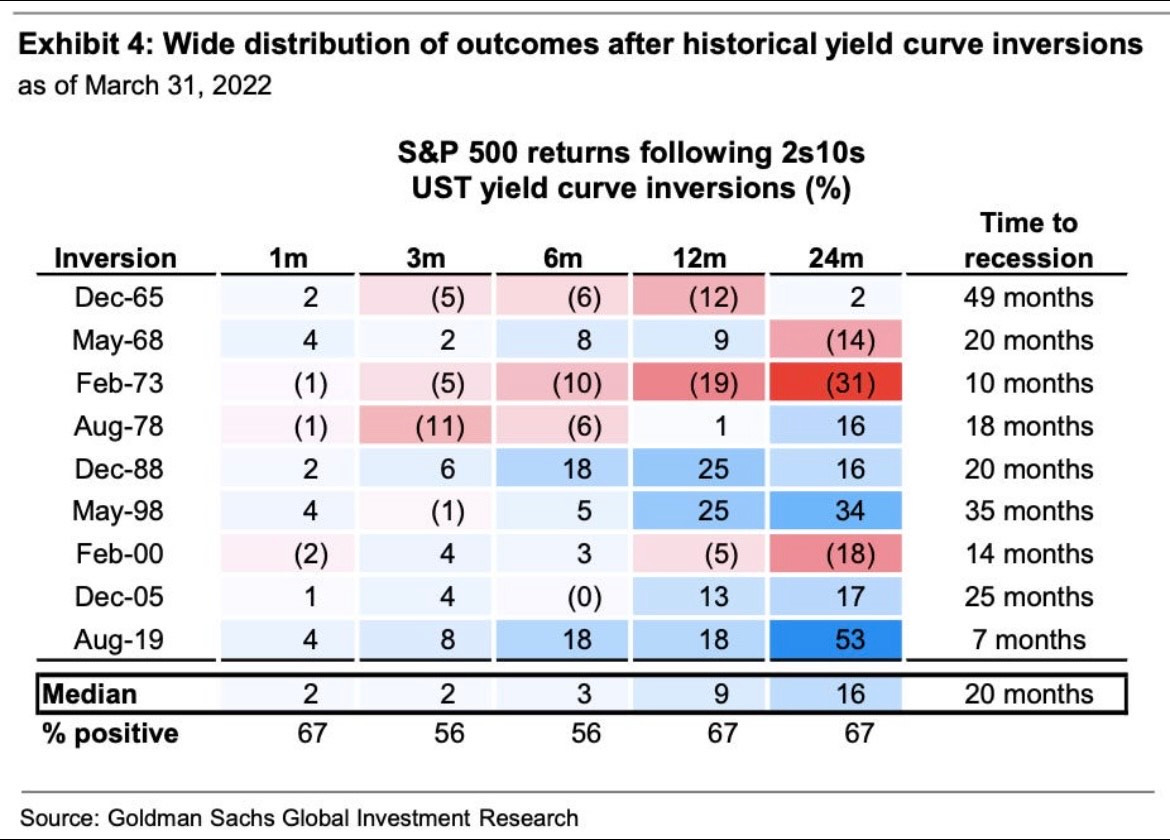
Next lets take a look at the 2s10s UST yield curve. (Figure 10) A lot of people (on Twitter at least) are under the false assumption that when the yield curve inverts the equity market will instantly drop several % or a recession will be right around the corner However, as Figure 10 shows the outcome to be rather diverse with the median time to a recession is 20 months and the average returns for the S&P being positive 67% of the time after 12 & 24 months. (Figure 11)
Corporate Bonds:
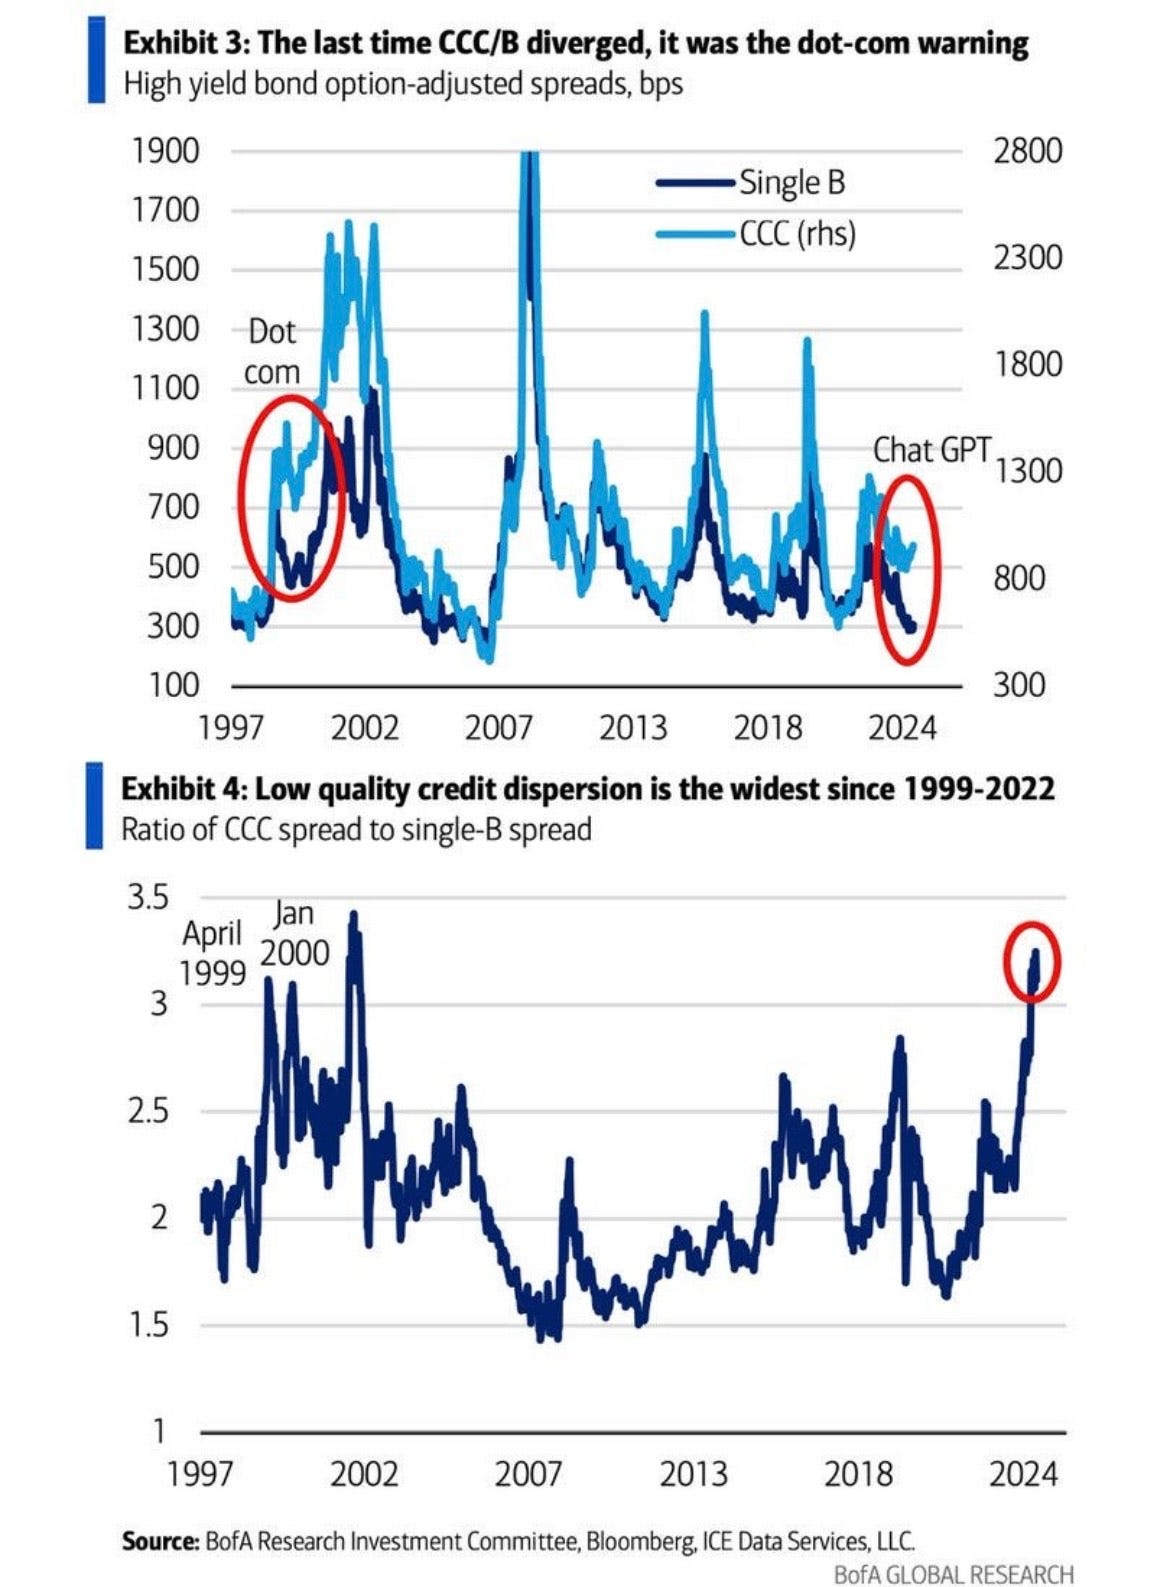
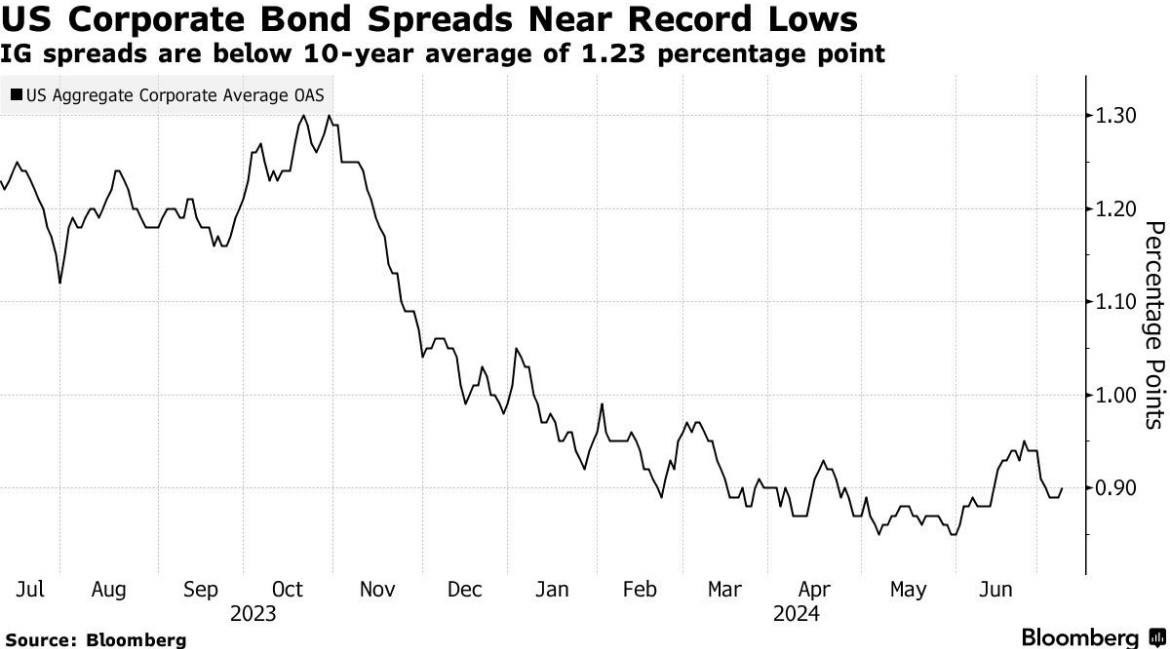
Recently CCC and B rated corp. bonds have diverged, the last time they diverged so much was during the Dot com bubble. (Figure 12) I would not put a huge amount of weight behind this signal. For example the CCC and B rated bonds have diverged before like 2002-2004. (Figure 12)
Conclusion:
I hope you all enjoyed this weeks Fixed Income Fixing. I wanted to bring this series back and any feedback about this article would be extremely helpful. Thank you all for the support, it is greatly appreciated. Finally, I’d like to announce that I am writing a longer form piece on an equity name in the Semiconductor space, I will be joined by a friend and we hope you find our upcoming article to be helpful. As always thank you for reading and any comments are greatly appreciated.
DISCLAIMER: We are not Financial Advisors, and all information presented is for educational purposes ONLY. Financial markets can be highly volatile, so good risk management is a must.





Excellent work!
Thank you I needed this.
I'm curious how reits fit in? I know they are different but they are also cousins in my mind. Maybe just that cousin I have to keep my 3rd 👁 on
Or mortgage backed bonds?
International bonds?
Junk bonds?
Etc.
And to be affirmed it's clearly the best of times to get a 2 month T bill at over 5 ÷ roi correct? Vs. sat a 1 year corporate grade bond typically wonderful although they're oricing that fed interest right out of my gains and I don't like that BS. However if I think in 4 Years time or so Lockheed Martin Boeing Northrup Grummon GE Aerospace,:Symbiotic, Novo Nordisk Biogen, Paypal, Palantir, AAOI, QBTS, IONQ, Constellation Energy, Apple, Volkswagon, Rivian, Quantumscape, META, META, NETFLIX, QBTS, AAOI, IONQ, MICROSOFT, Altria, VISA, Samsung, Raytheon, general dynamics, Pratt and Whitney, IBM, CISCO, T-MOBILE, VERIZON, CHASE, TESLA, GM, NIO, MITSUBISHI, ANHAUSER BUSCH, CHEVRON, EXXONMOBIL, INTEL, ELLI LILLY, Honeywell, LG, JBL, and will be doing very wel or ok hopefully on the smaller ones with big upside and interest rates will be down around Crowdstrike, Palo Alto, Chick-fil-A, Starbucks, super micro chips manufacturing, Broadcom, (hydrogenated nitrogen engine)
(graphene companies) ; ethereum, bitcoin