

Fixed Income Fixing 12/29/23
Fixed Income Fixing 12/29/23
A quick review of Fixed Income during 2023

Table of Contents
US Treasuries (UST)
Yield Curves
Corporate Bonds
USTs:
A lot has happened in the US Treasury (UST) market since I last wrote a Fixed Income Fixing. Since then short term USTs hit their highest level since 2000. They have cooled off across the yield curve but let me try and summarize USTs in 2023. The UST aggregate index was up over 4% by February 2nd as bonds rallied to start the year. Then concerns over just how high and fast the Fed would go drove a selloff to March 2nd lows down 76 bps YTD. Concerns over US bank liquidity drove another surge to a 4.05% gain as-of April 5th. But then a steady selloff all summer and in to the fall had global bonds down 3.78% by mid-October. Since, another Fed hint towards a pivot has meant a surge that has taken bonds to annual highs. Many of those swings were of course driven by duration, rather than credit risk: global high yield bonds have been up YTD all of 2023 and their recent surge from a 3.25% YTD gain on October 20th to their 13.15% YTD gain as-of this writing illustrates how credit has been such an outsize driver of returns this year.
Now let’s take quick look at the year to date performance of the UST bond yields.
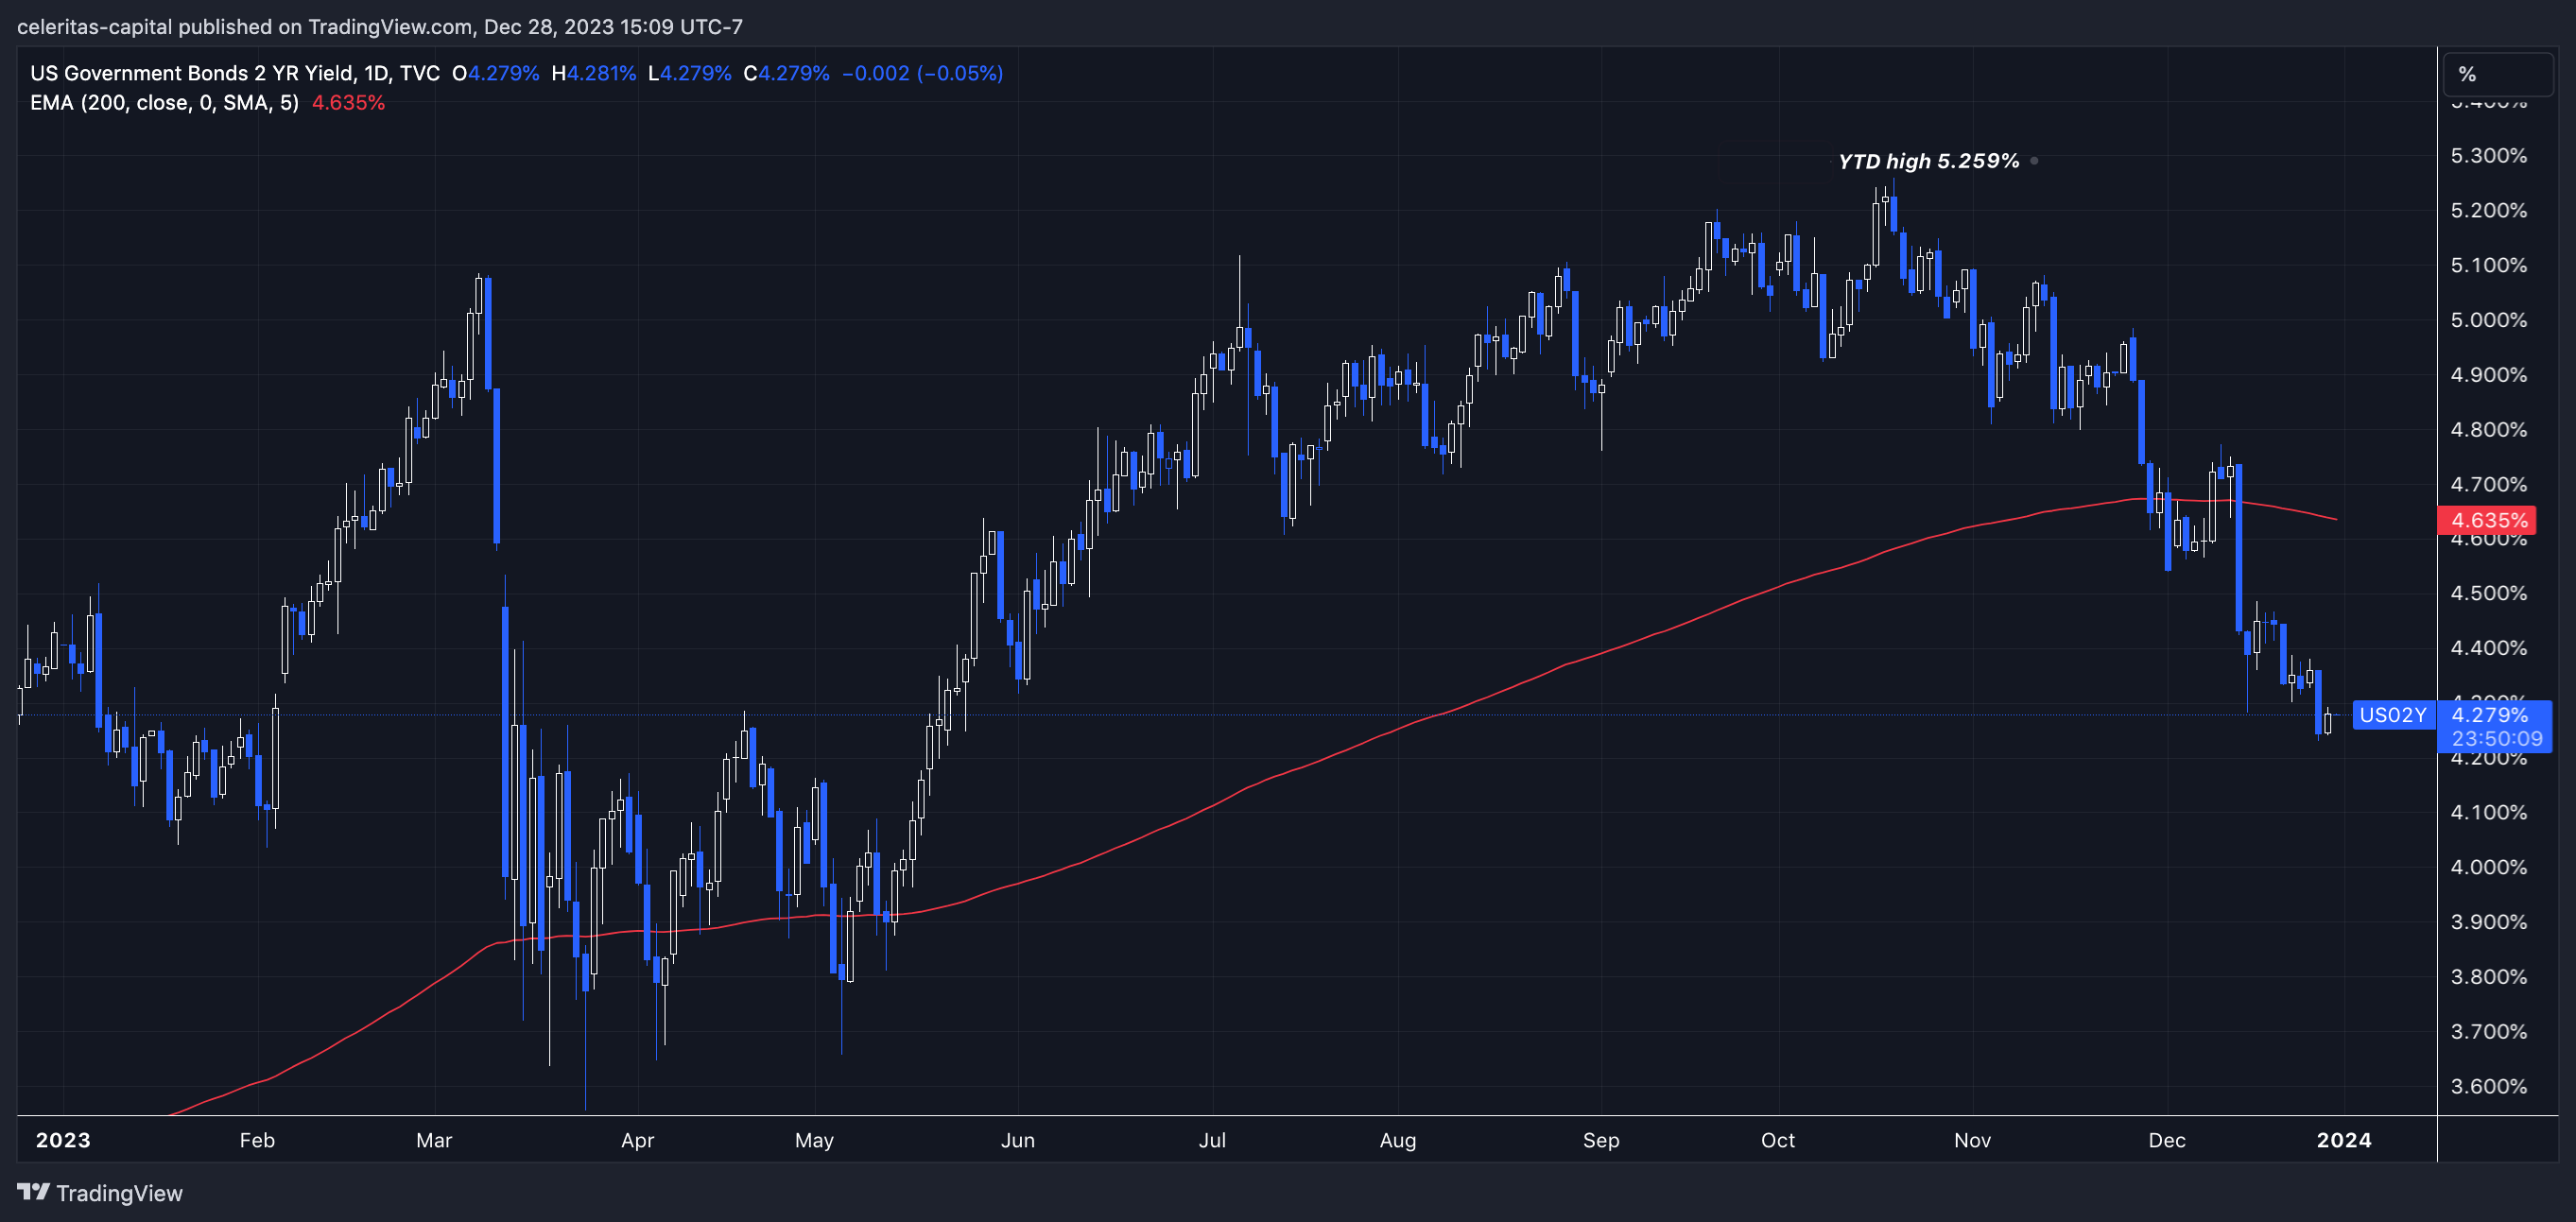

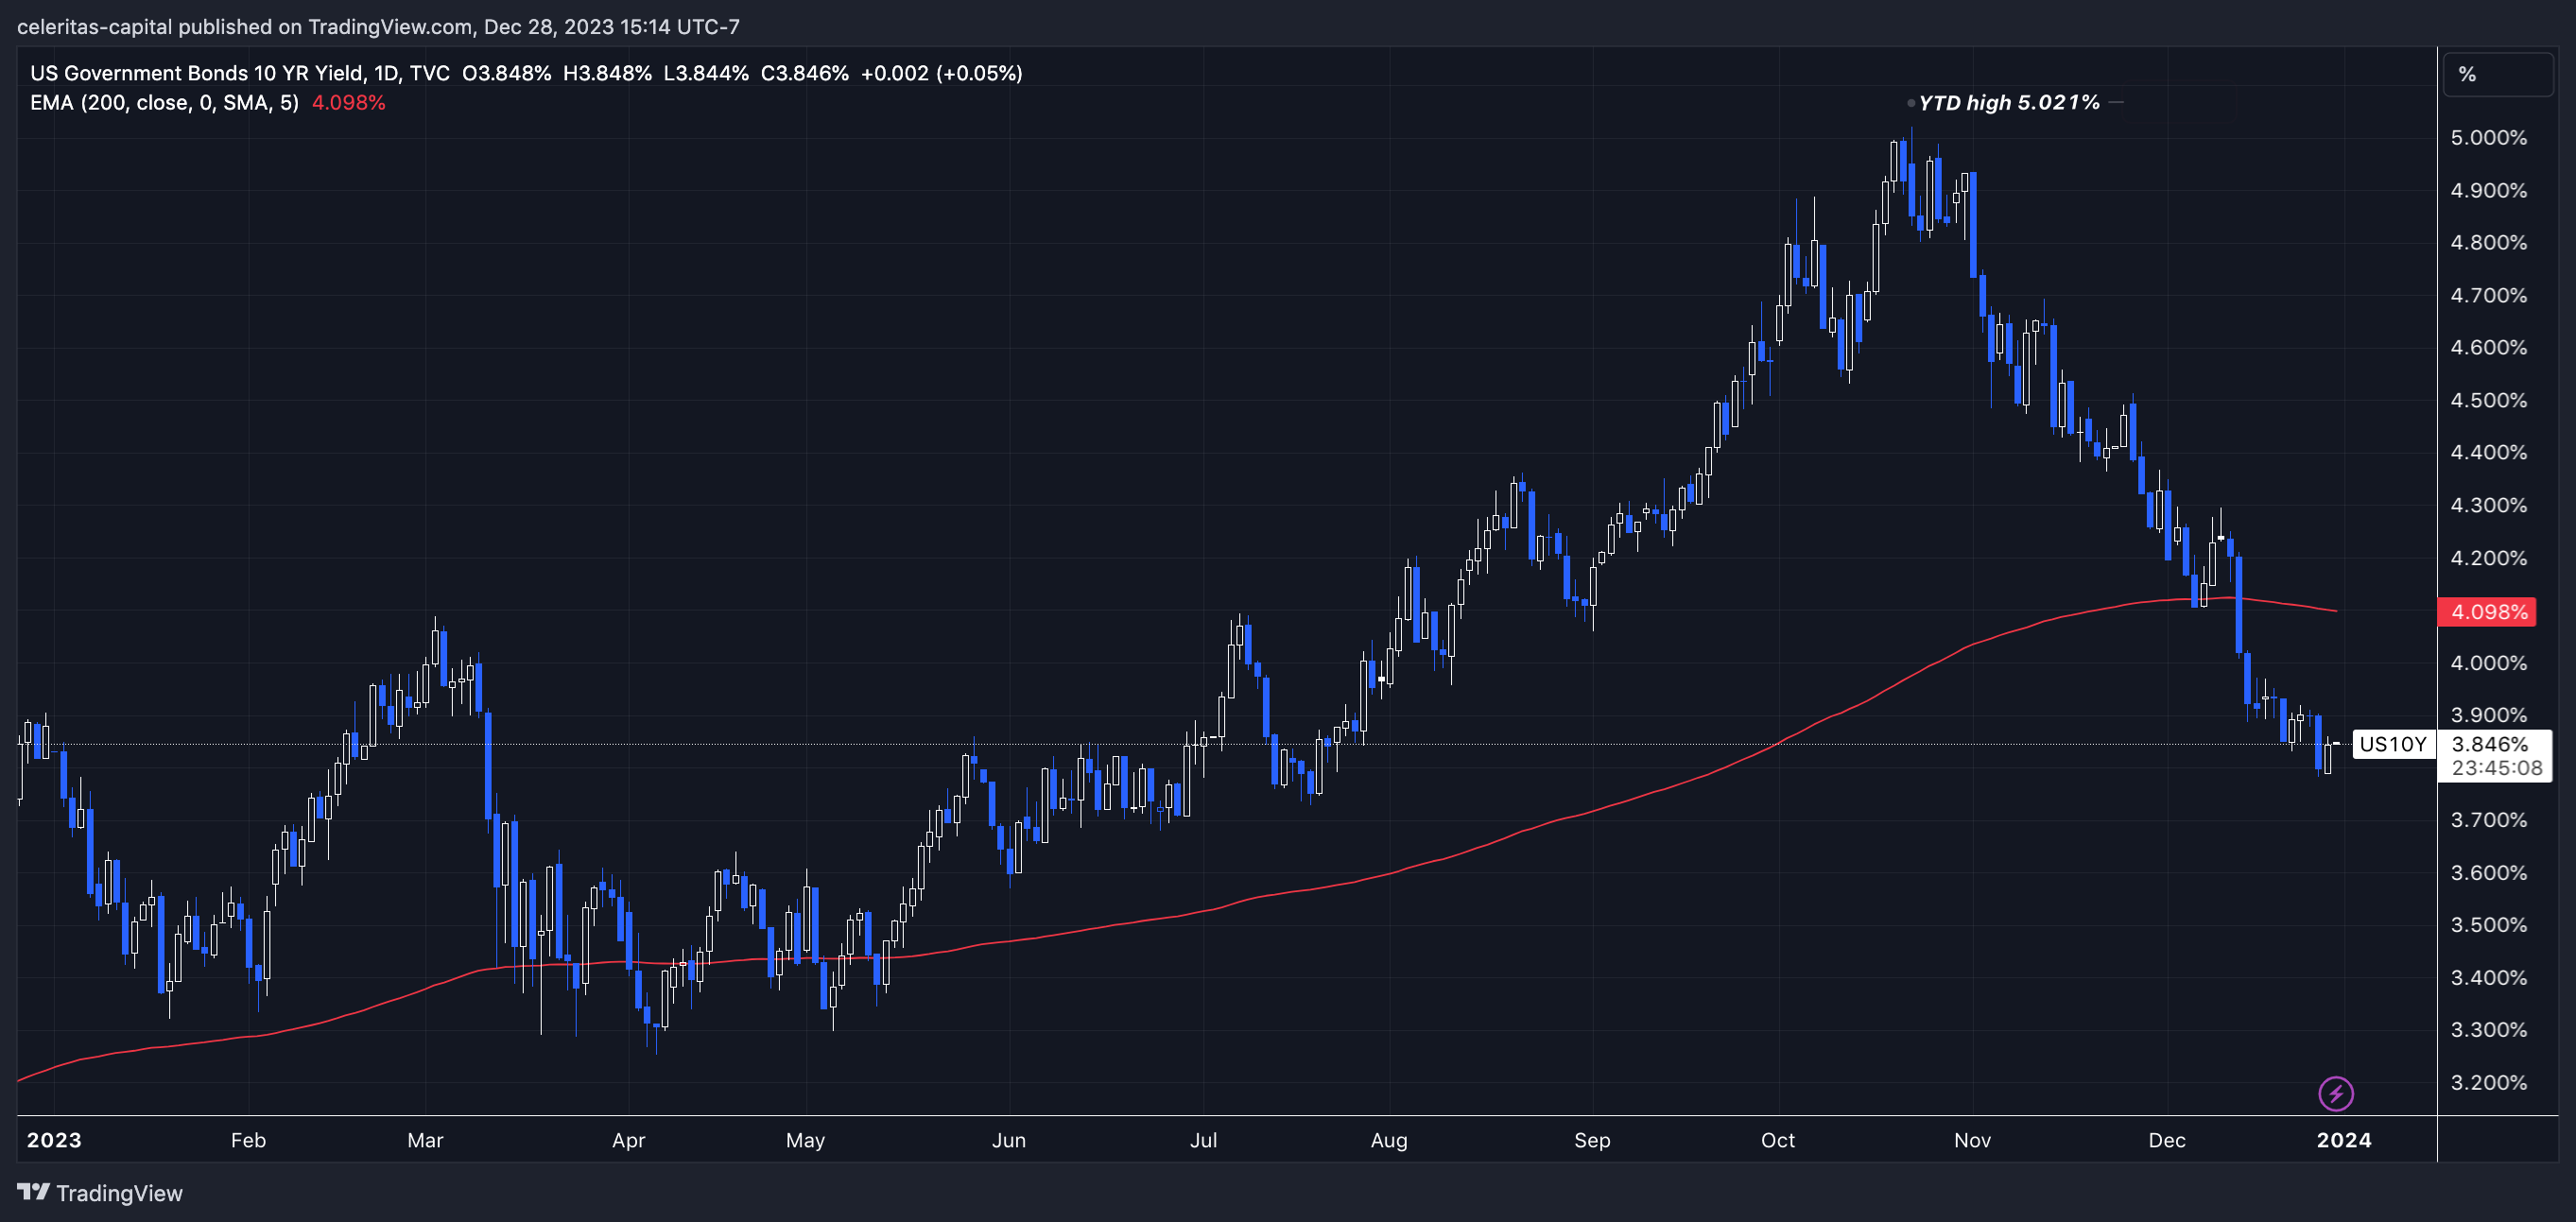


Below is the futures pricing year to date for each of the major UST contracts. (Figure 6)

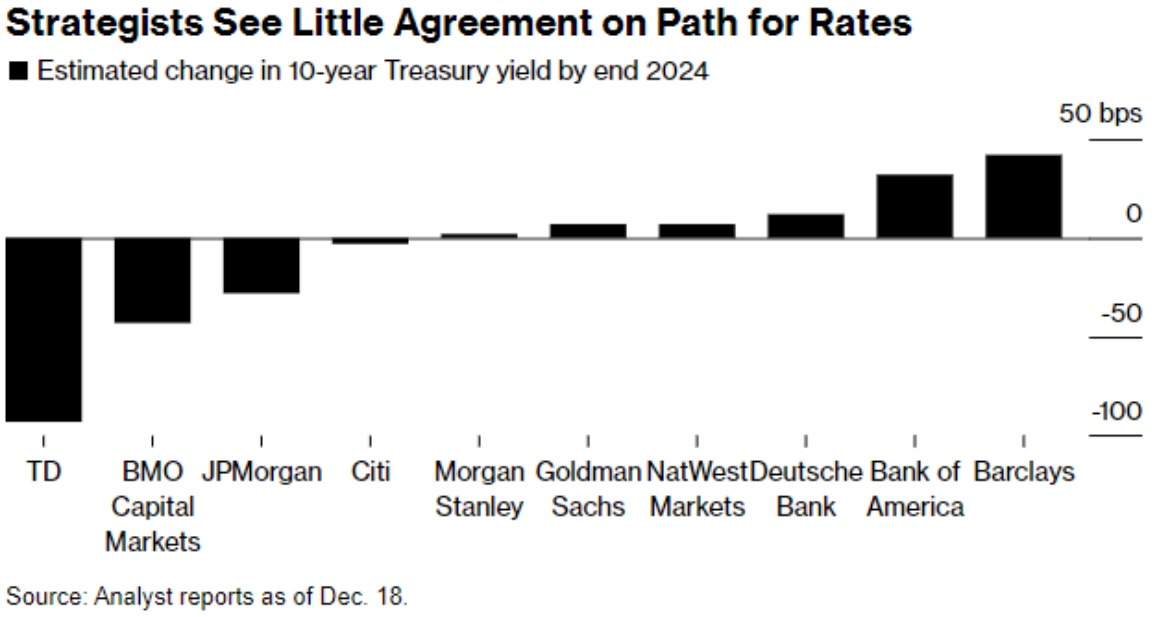
Now what is next for USTs, well I of course can’t say anything as a certainty. However, yields and therefore pricing will be driven (especially the lower duration bonds) by the FED Funds rate. The Street certainly doesn’t have a uniform view for what the FED will do next see Figure 7 for evidence of that.
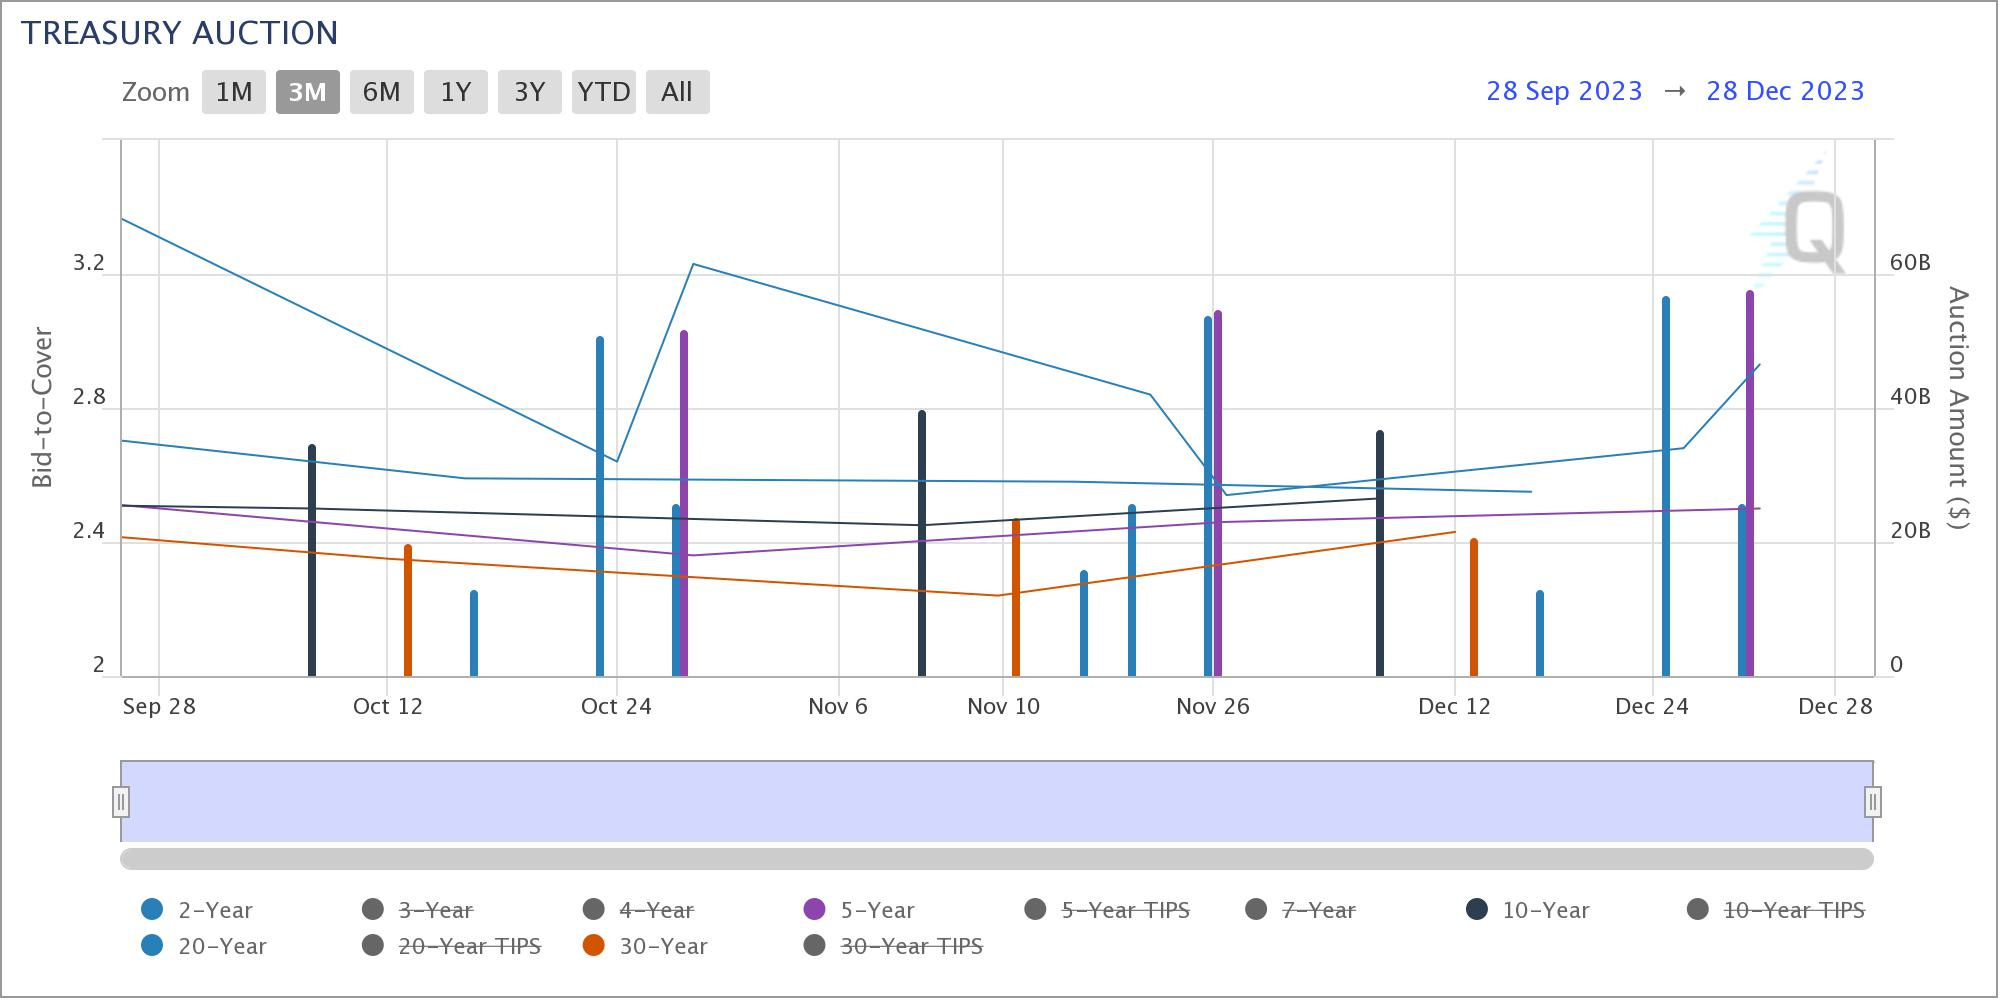
The US Treasury has been auctioning of bonds of all durations since my last Fixed Income Fixing post. With a varying degree of success, the lower the the Bid-to-Cover ratio pretty much shows less demand than a high Bid-to-Cover ratio. (Figure 8)
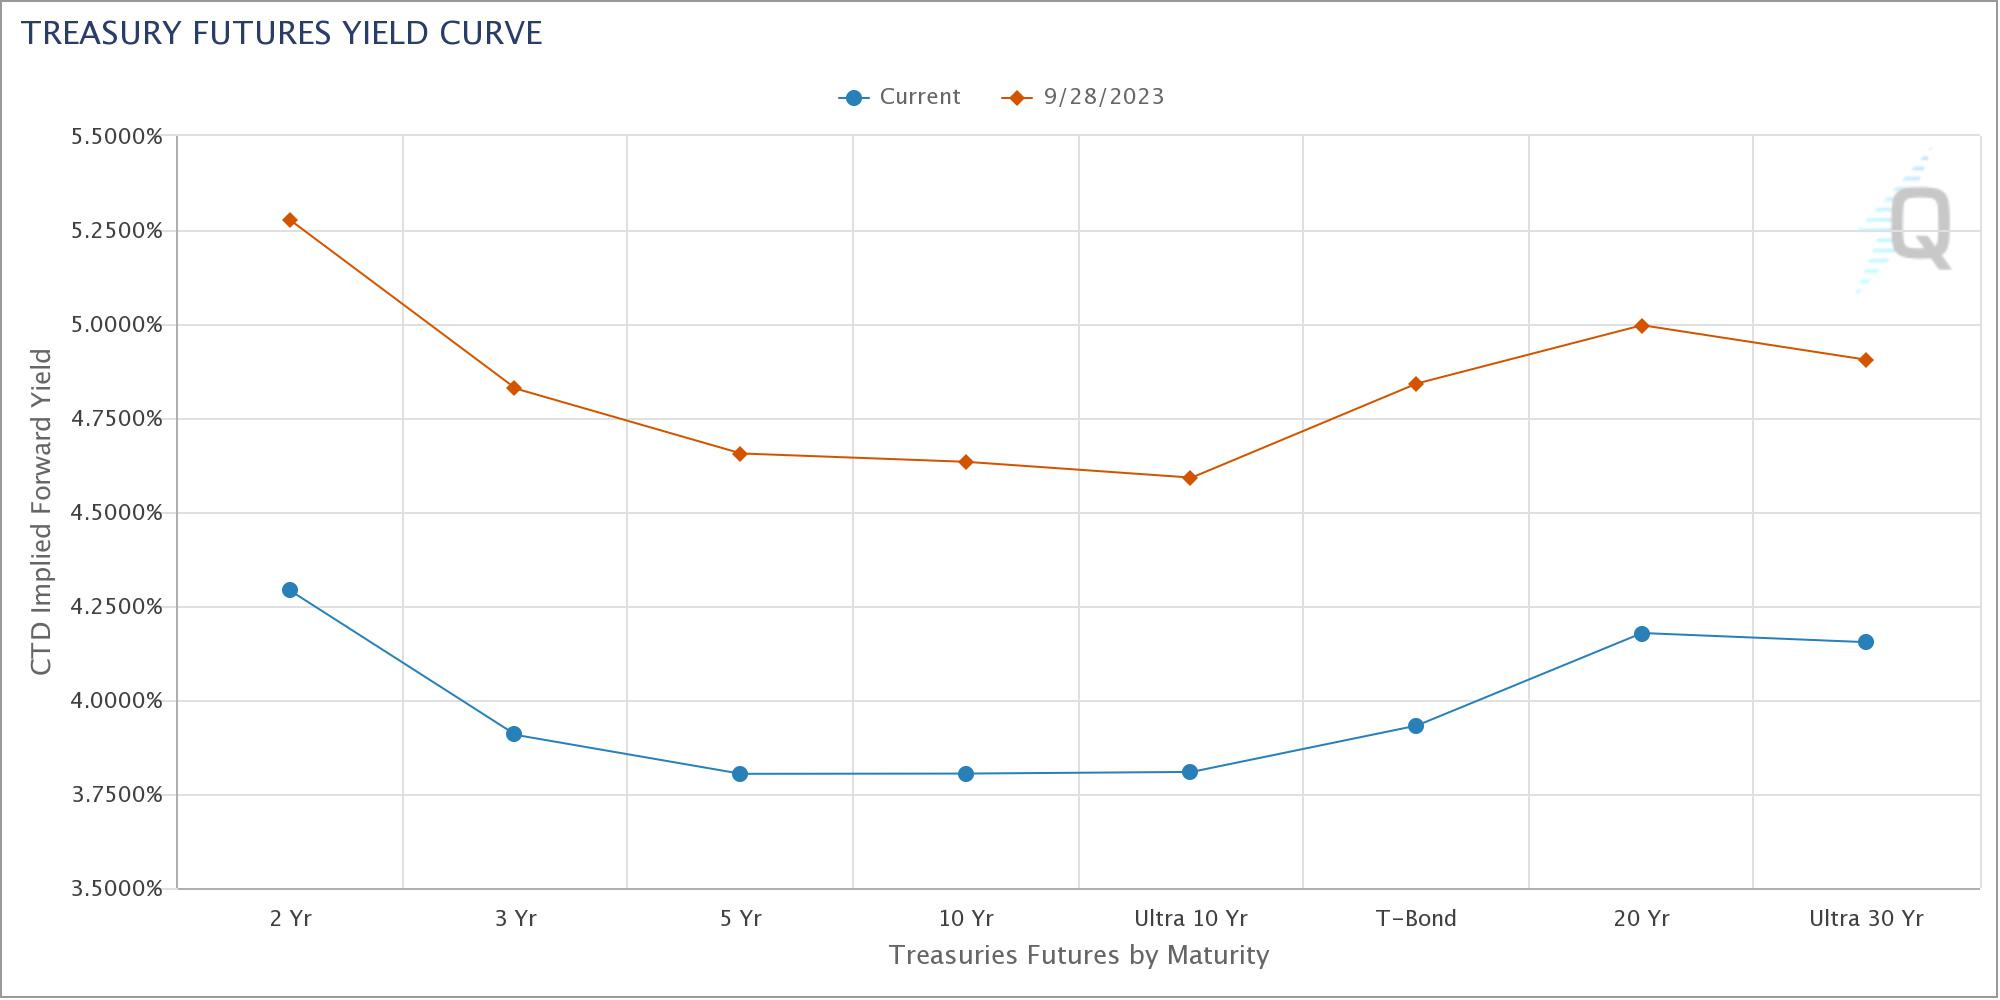
Yield Curves:
Although I harbor skepticism regarding the compelling value of risk-free rates at current levels, Treasuries persist in their massive decline in yield, a trend that commenced in October. Recognizing market excesses for what they are, it is plausible that yields could further deviate from fair value. However, from my perspective, positions with long duration should now be approaching the levels for profit-taking.
Corporate Bonds:
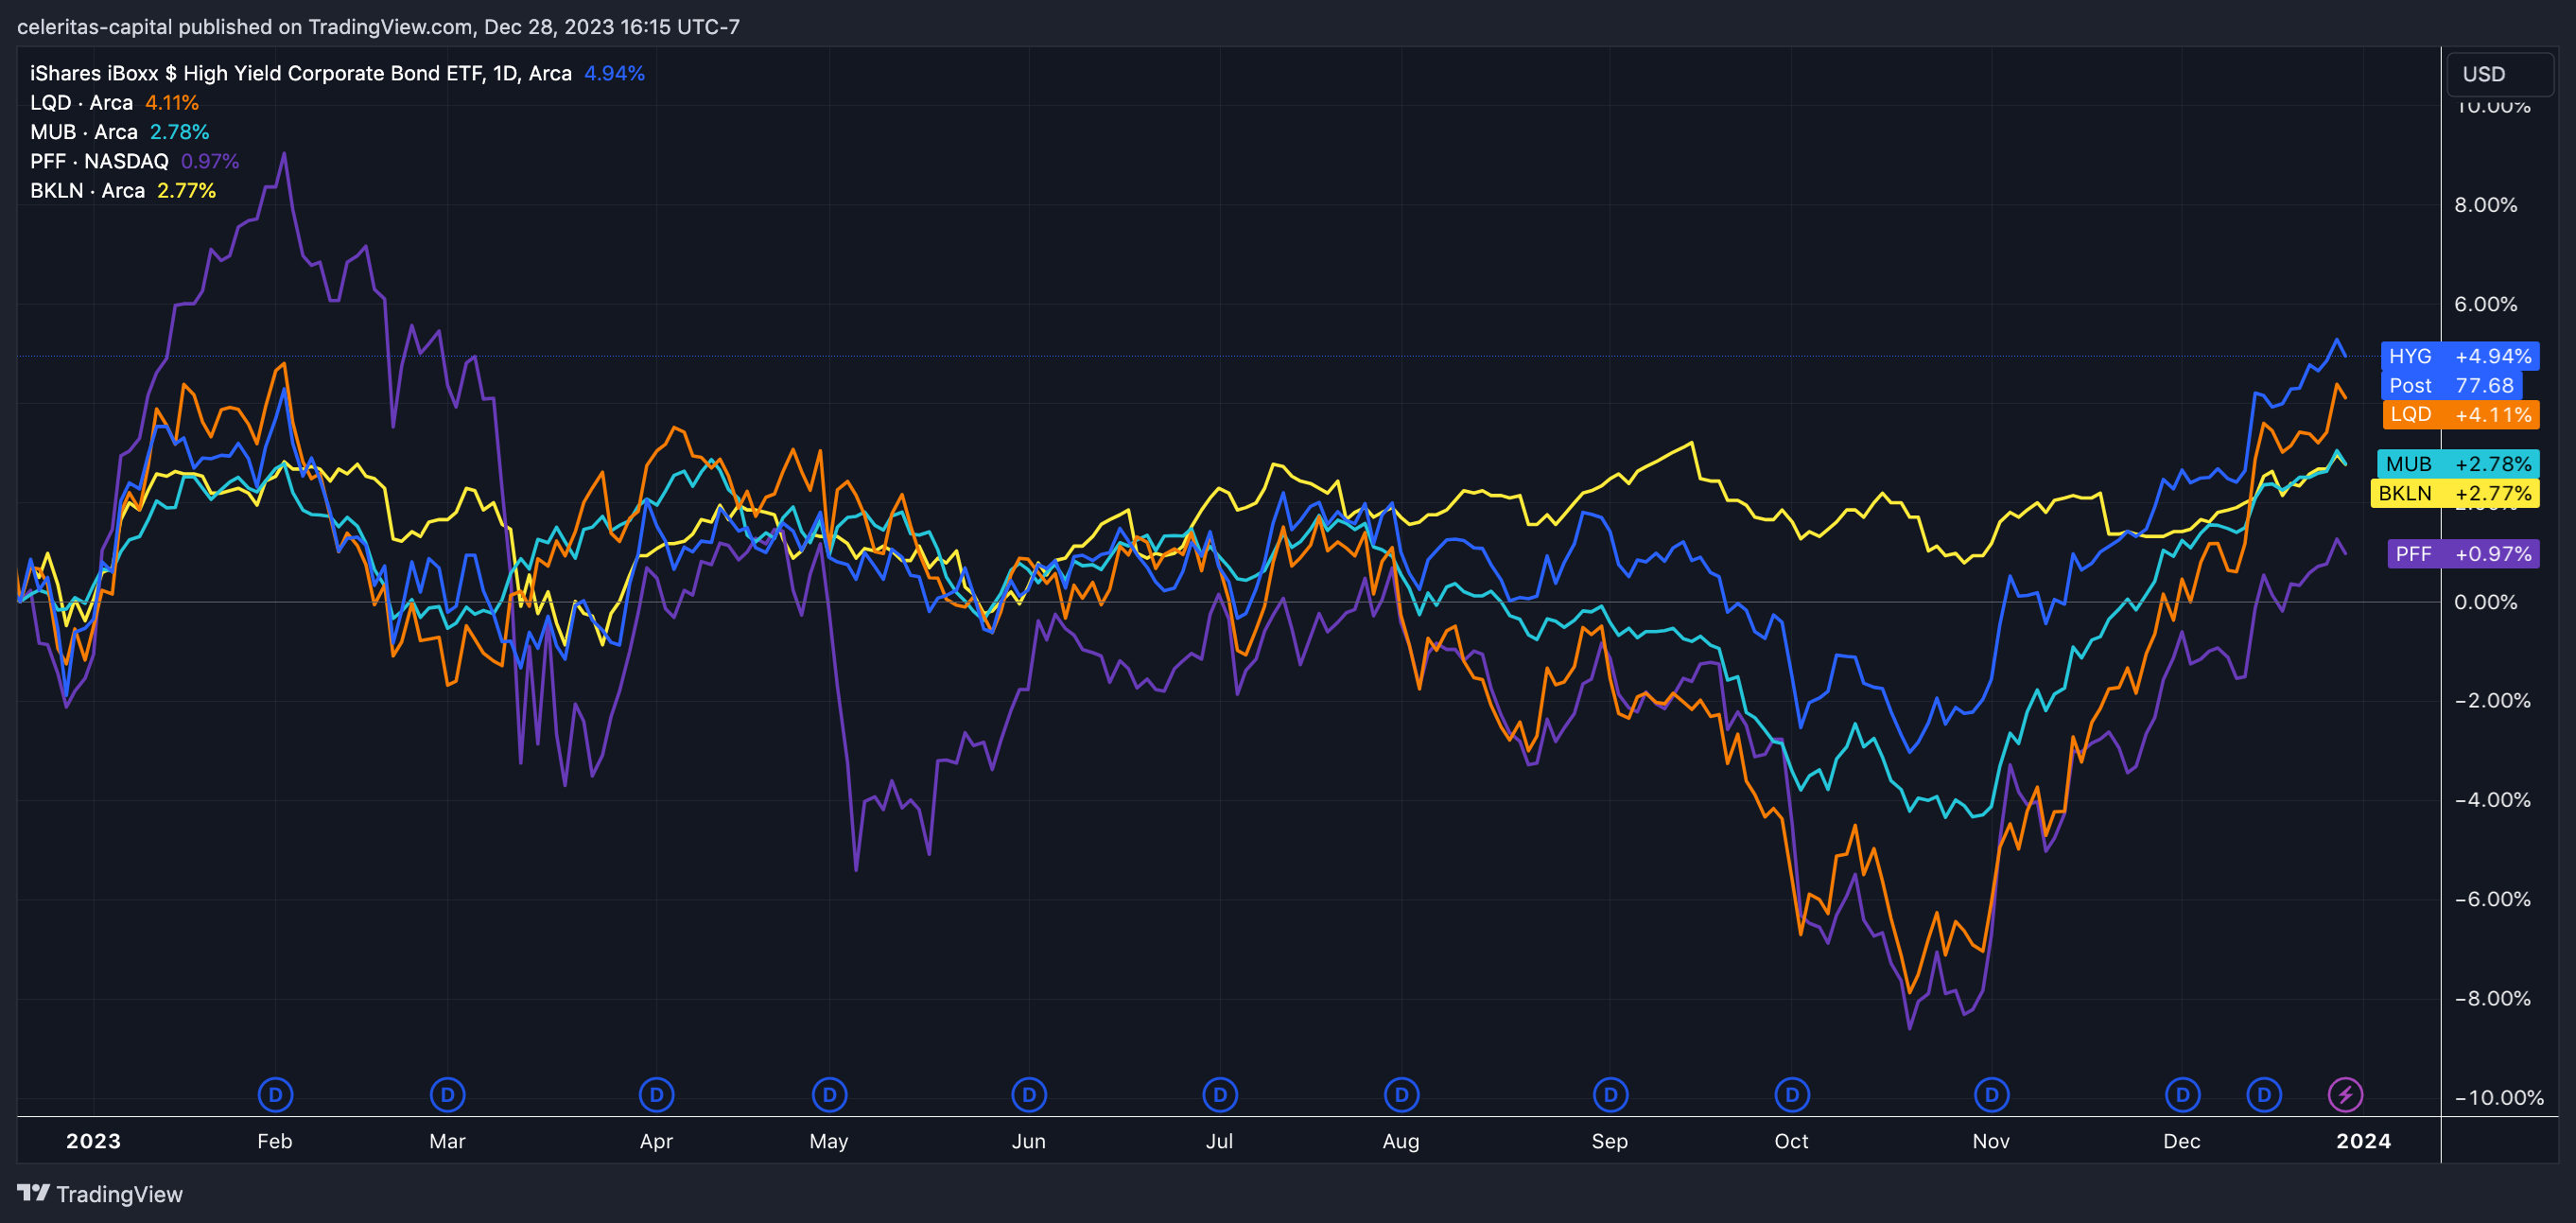
Figure 10 below shows the year-to-date of the major corporate bond ETFs (along with the MBS ETF). (Figure 10) High yield, HYG 0.00%↑ lead the way this year followed closely by investment grade bond LQD 0.00%↑. Interestingly prefered shares started this year extremely strong before getting hit by the economic uncertainty in March, PFF 0.00%↑.
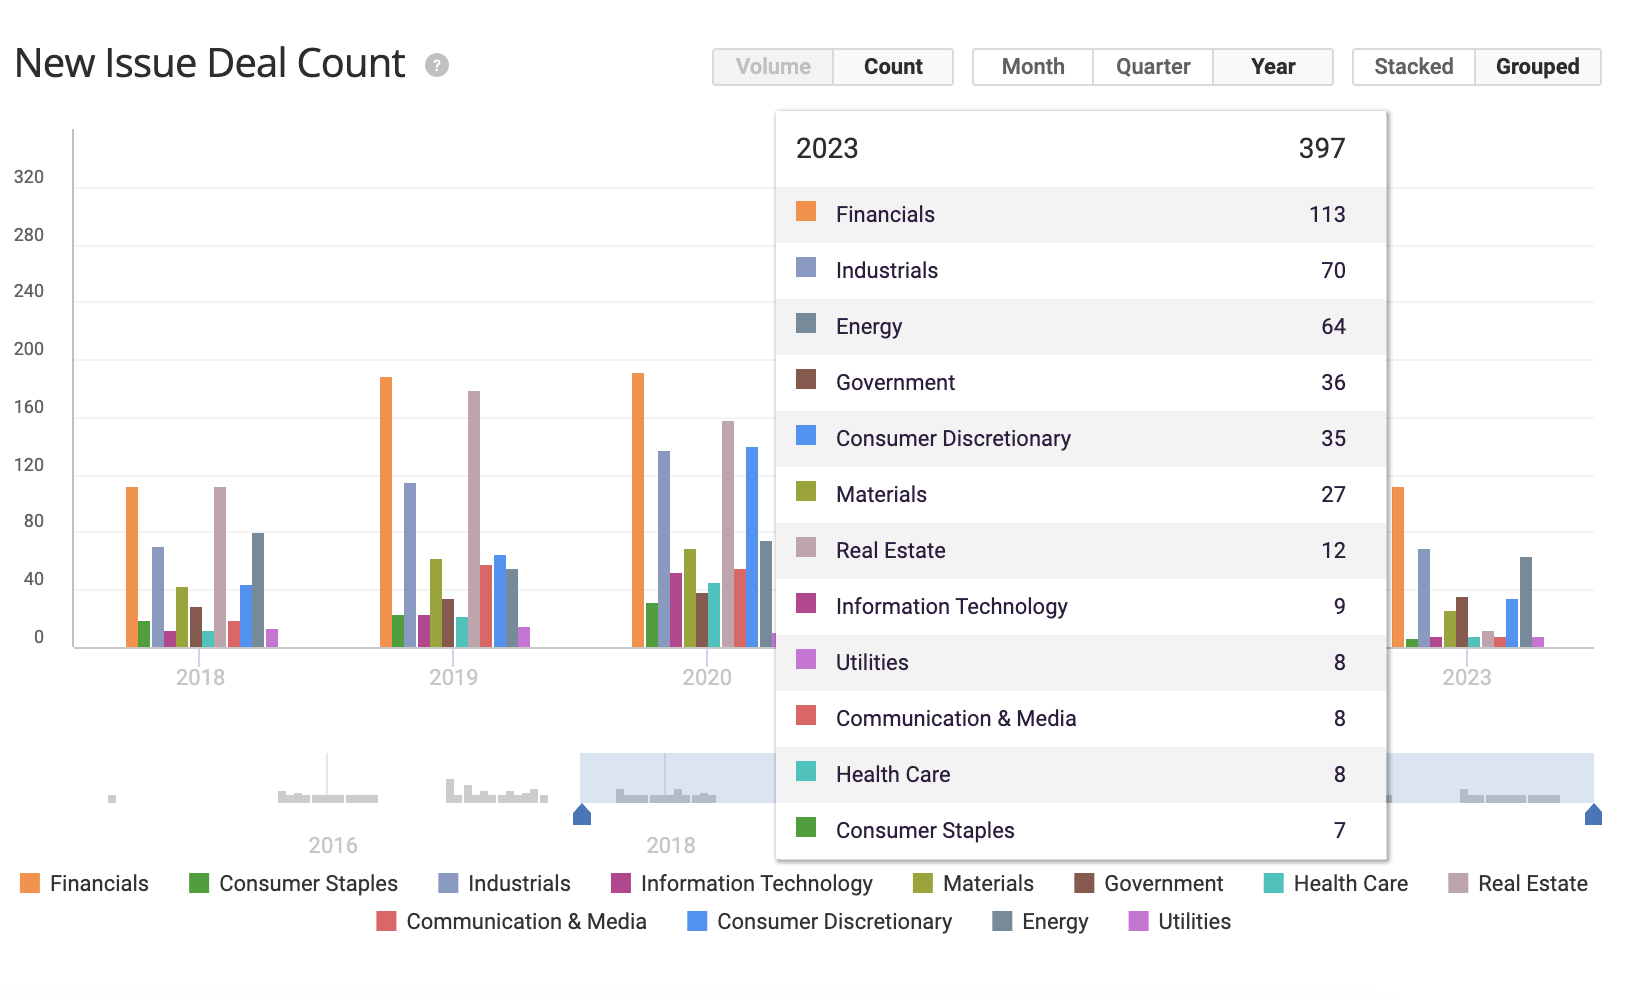
As for how many corporate bonds were issued this year we did see a slight drop in new issuances especially in high yields. (Figure 11) The financial sector had the largest number of new offerings for both HY and IG. (Figure 11 & 12)
Thank you for reading this week’s edition of Fixed Income Fixing. Apologies for the rather short edition this week, with it being the end of the year news is rather slow at the moment. I have an exciting announcement, I have been researching corporate bonds recently and decided I will write my first educational primer on corp. bonds! So be on the lookout for that coming soon. As always feel free to leave any questions in the comments!
DISCLAIMER: We are not Financial Advisors, and all information presented is for educational purposes ONLY. Financial markets can be highly volatile, so good risk management is a must.