
ESH26 Market Positioning:
A look at how the market is positioning in ESH26 options

Welcome to a quick post about how the market internals are looking on ESH26. A quick note from Celeriats Capital, thank you all for reading and sticking with me through my posting drought. I hope to have more content coming to your inboxes soon!
Open Interest (OI) and Volume for ESH26:
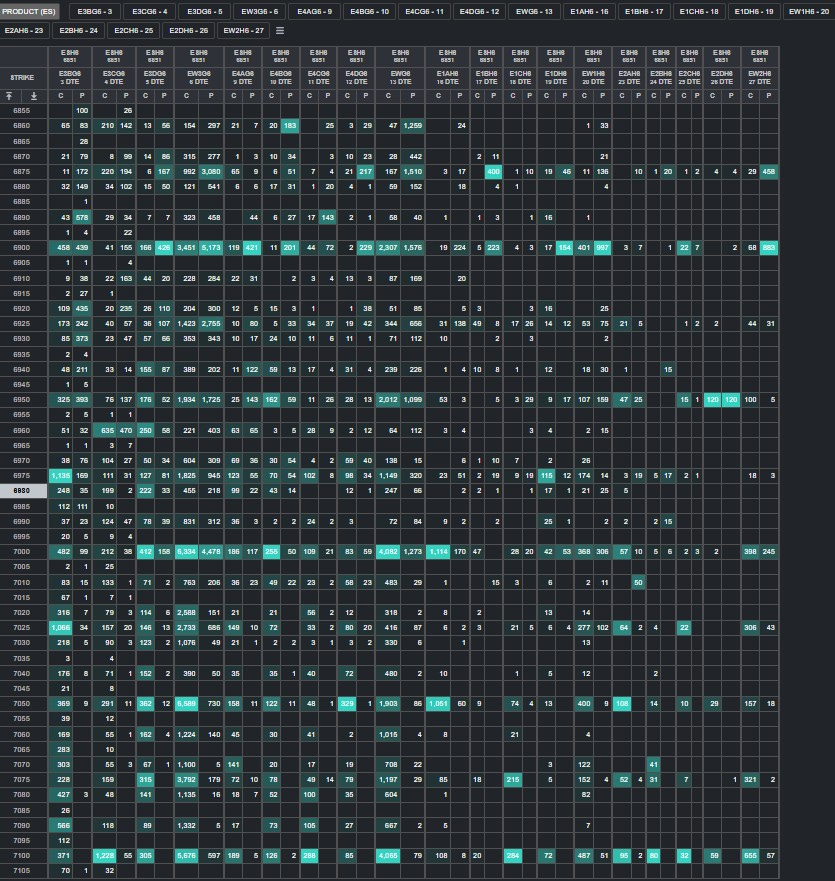
Below is an open interest heatmap with expirations for the next 27 days. (Figure 1)The Figure captures what the market saw at close on Monday the 9th. This heatmap highlights large OI by expiry, as you can see call OI for wingy calls (think 25D-15D) was not that large on Monday. (Figure 1) In Fact one of the largest call OI was actually ITM, with some notable large OI at the at the 7000c. But this was Monday’s view lets take a look at how we ended this week in regards to OI on ES.
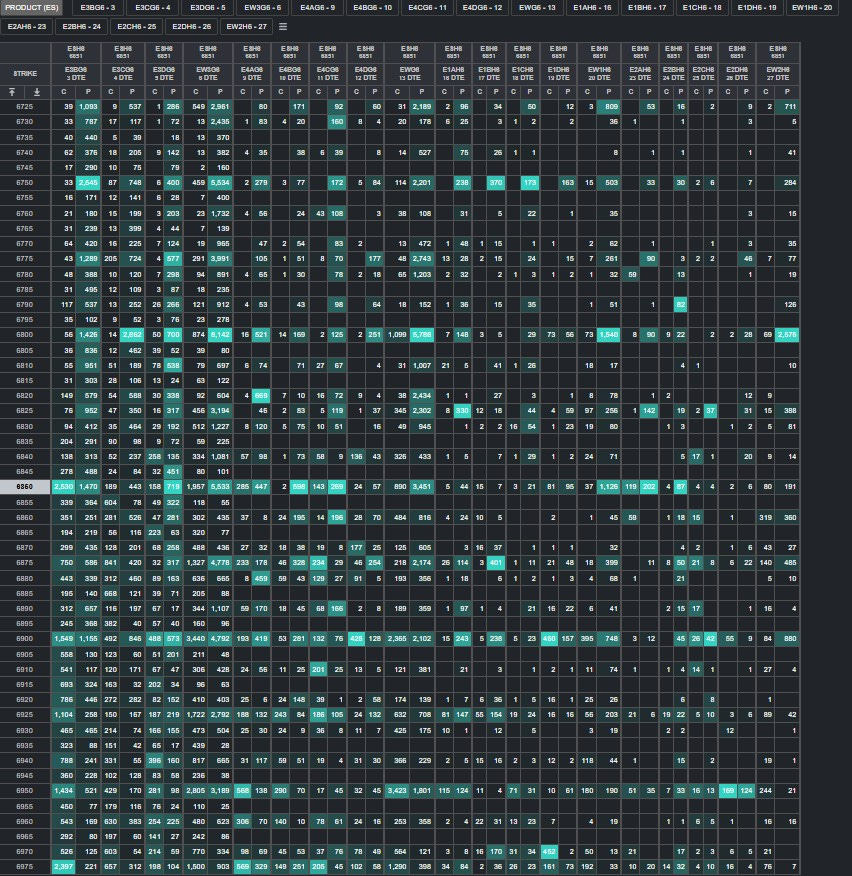
If you take a look at Figure 2 you will notice a few things, first the ATM strike rolled down as ES finished the week down -1.16%. (Figure 2) Second you will notice put OI expanded during last week especially between the strikes of 6800-6750 with most of the OI being focused on the contract that expires 2/17/26, which is the first full trading day for futures after Presidents Day. OI is nice to be aware of but let’s take a look at volume now.
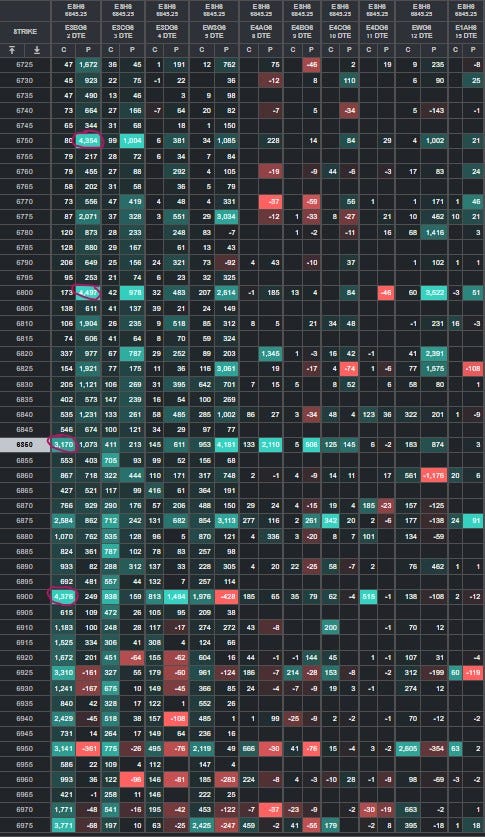
We will be comparing the volume from Monday the 9th to Fridays volume. Below Figure 3 is a heatmap matrix that is comparing the change in volume at the 25 strikes closet to ATM. I circled the increased volume at the 6850 strike along with circling two decent increased volume on the 6800 & 6750 puts. In my mind the increase in those puts is likely a market participant hedging for more possible downside. 25D put skew on ESH26 has continued to bid up. We will talk more about skew later in the piece. I also circled the 6900 call which gained quite some volume again could be a hedge or some market participants could be leaning bullish after Friday’s close. The next volume change that caught my eye was the large the large put volume on the 2/20 expiration at the strikes 6775, 6800 and 6850. (Figure 3) To me this looks like hedgeding for the large amount of economic data releasing Friday 2/20. Market participants also traded more calls last Friday compared to last Monday. I interpret the data like this some market participants expect to see some a relief from last week. (Figure 3) The decrease in volume on the 2/20 6900 put adds to this idea. But this could always be calling selling.
Volatility and Skew on ESH26:
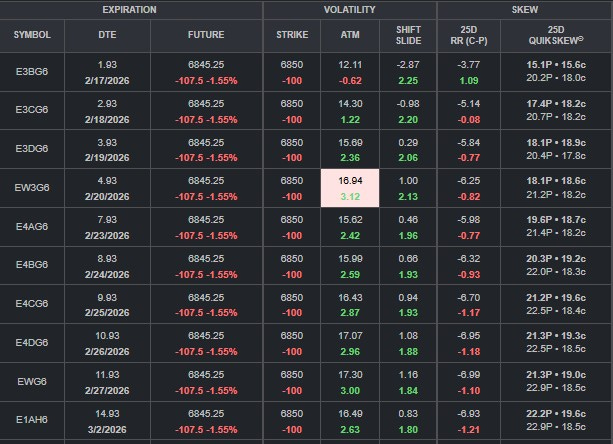
Figure 4 is nice compact way to look at volatility, one thing you will notice is that the ATM volatility is evaluated Friday when compared to Tuesday volatility. This is almost certainly due to the high impact economic data releasing on Friday. Friday the 20th we have USA GDP Growth QoQ and even more importantly we the PCE print. Interestingly the 25D QuikSkew is telling us that last Friday for the EW3G6 contract (2/20) the 25D put decreased in vol from 21.2 to 18.1. While the 25D call for EW3G6 had its vol increase slightly from 18.2 to 18.6. In my opinion this implies call vol on that specific contract is catching a bid which is interesting to me considering the economic data coming Friday. Also a quick explanation of what QuikSkew is so the letters represent the put and call - as this expect. The capital letter indicates that the volatility is higher than the ATM vol by 18.9% (not vol percent but actual percent of ATM vol) and the bottom set of numbers represent what it opened at.
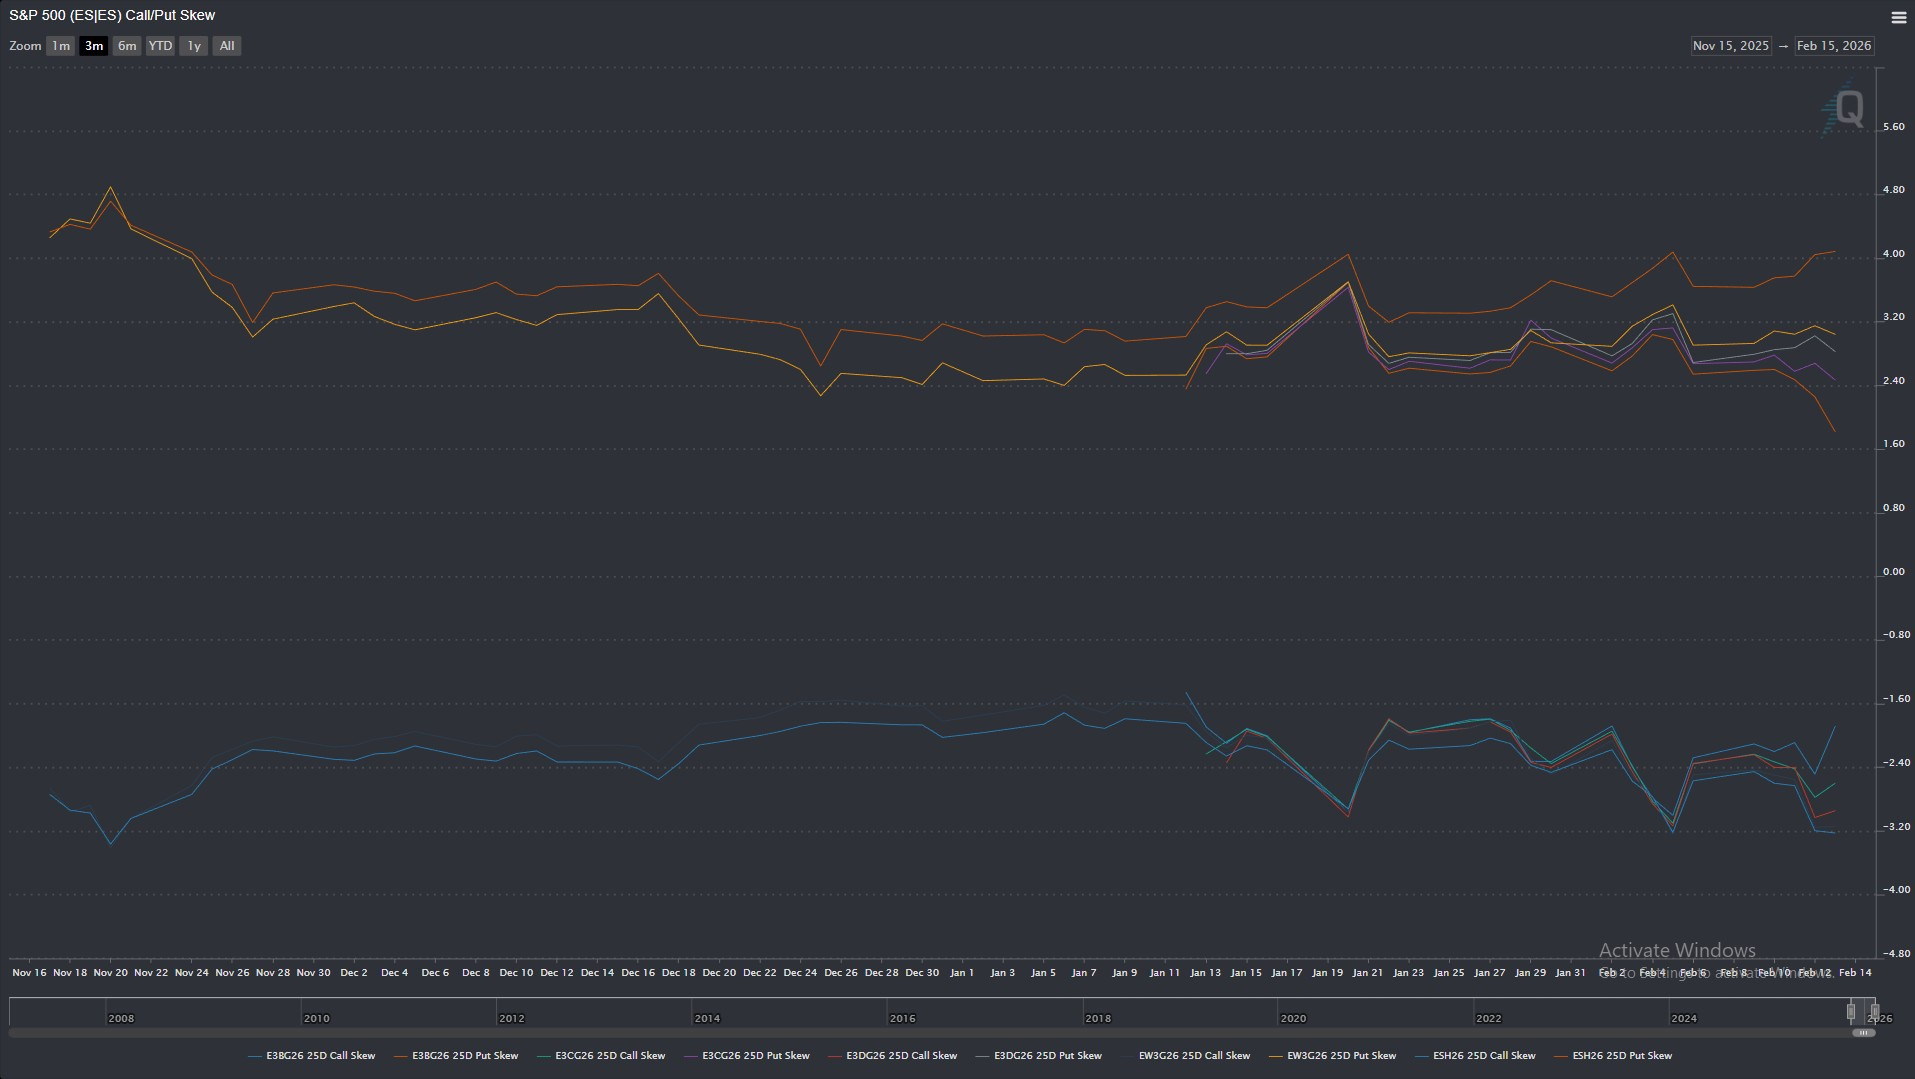
Now for some skew! If you‘ll notice the 25D put skew is dropping for every contract but the 2/17 expiration which in the Figure 5 is the darker orange line. Call skew is also picking up from its recent lows. If 25D call skew picks up some more steam it could signal a relief bounce back on the index.
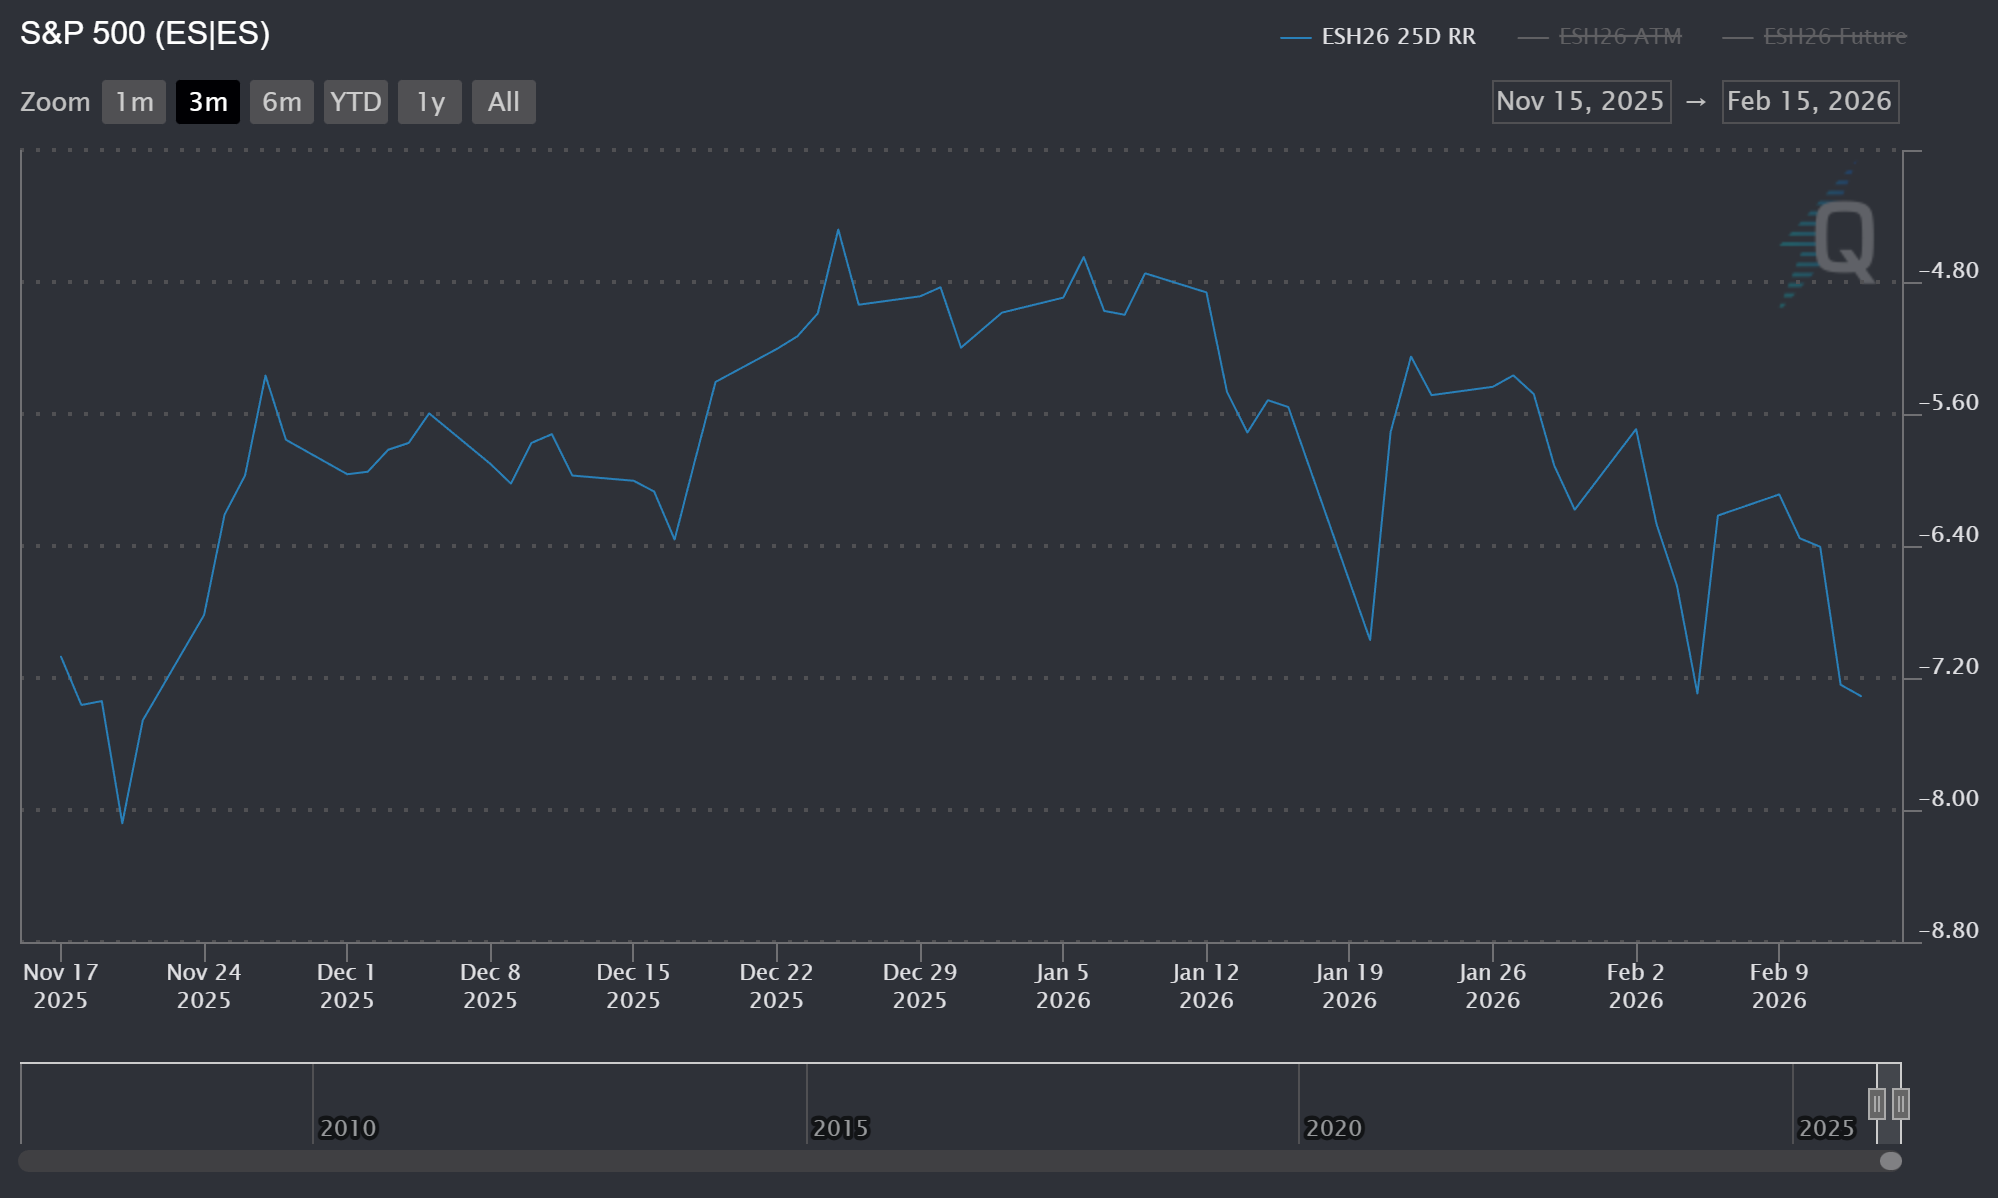
At the start of last week ESH26 25D RR measured in at -5.69 as of Friday’s it had dropped to -7.31. Despite the market already dropping ~100 points, traders are paying significantly more for downside protection now than they were at the highs. This could suggests "crash anxiety." The ESH26 RR closed below -7 three times in the last 3 months. The most recent was February 5th with ES closing -1.24% with a trading range of 157.50. The second time was January 20th with ES closing -2.11%. And the final one I’ll mention was on November 20th again ES closed down -1.56%. If you look at Figure 7 you’ll quickly notice after the RR hit that level it violently repriced to the up side. Which also happens to the price of ES just look at a chart the day after any of the aforementioned dates. Also very import note -7 isn’t some magic floor for the RR it can and has gone much lower. With the short trading week this is something to watch for sure. The real question is -7.31 as low as we go on the RR or do we go even lower?
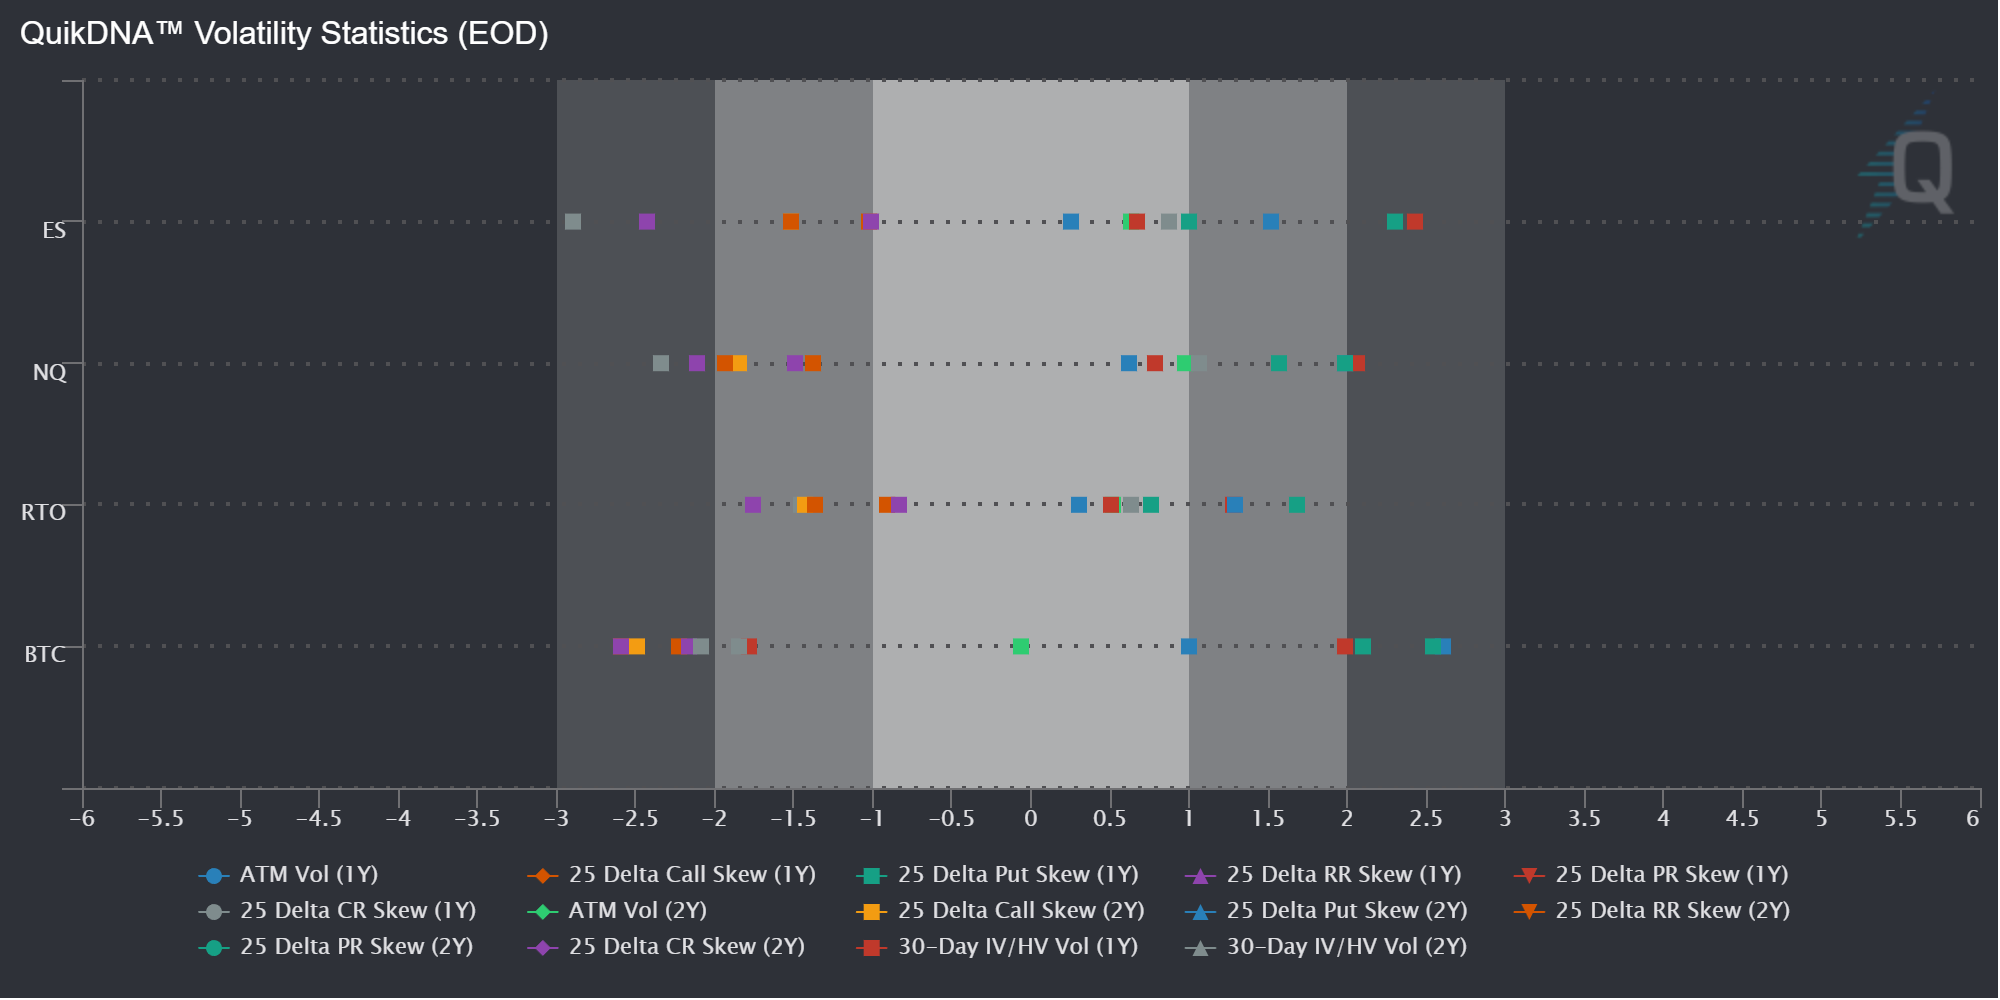
QuikDNA is a great tool that lets you quickly see different vol and skew metrics from a historical viewpoint using Z-Scores. (Figure 8)
That is all I have for now. I would like to make this something more regular and in-depth but I wanted to see how my readers would react to it first. If you liked it please leave a comment with feedback and any other futures you would like me to explore. Also I am self taught in-regards to everything related to trading or finance so I’m certain to make mistakes, if you could point these out I would greatly appreciate it.
All charts or figures in this post are from either QuikStrike or QuikVol.I can’t recommend both products enough if your a futures trader they are a must. But they didn’t forget about equity and ETF bros either. They have a new addition named QuikOptions, if you trade options on indexes, ETFs or single name equites they have a toolkit that will help you immensely in trading.