


Celeritas outlook for the rest of 2024
Looking ahead to the end of this year and market expectations. Along with going over some economic data and trades.

Introduction-
Hello everyone welcome back to Celeritas Capital. In todays post we are going to cover how I am thinking about the rest of this year. I plan on going over how I expect the election could effect markets, along with what has happened after past FED rate cuts (considering we got a 50 BPS cut last meeting). We will also go over the labor market, trades I’m looking at through the end of the year and beyond. I hope this article helps you prepare for the rest of this year. As always any feedback is welcome in the comments below! Lets get into it.
What has happened after past FED cuts?-
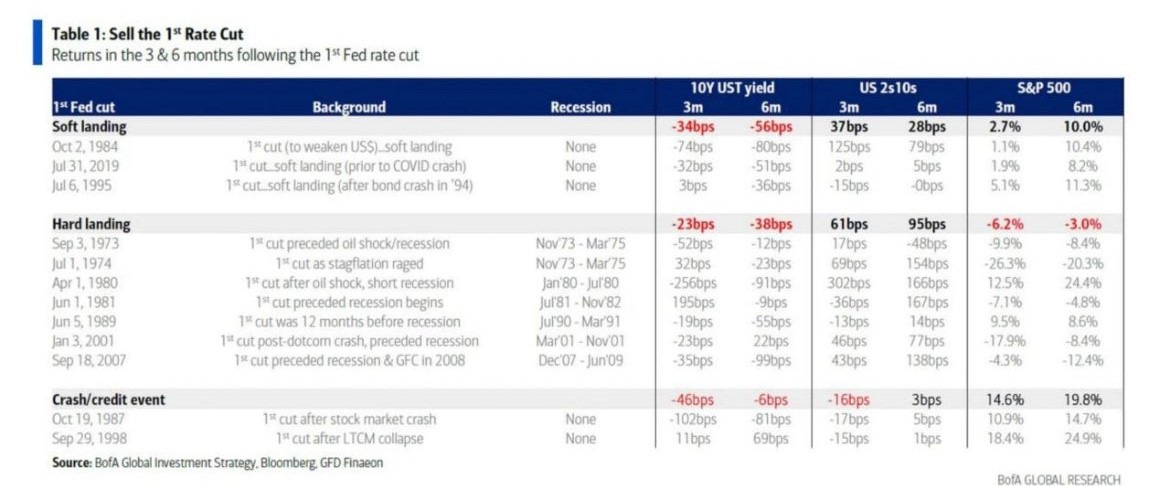
Many people are now wondering now that the FED cut rates by 50 BPS what will happen now? Will there be a recession or will stocks keep melting up? Well nobody knows for sure but I like to look at the past to get a possible indication of the future. Let’s start with some research from BofA. (Figure 1) According to the data complied by BofA in a soft landing the S&P 500 has positive returns in the first 3 & 6 months following a FED cut. (Figure 1) With hard landings having negative S&P 500 returns in the 3 & 6 months following a FED cut. (Figure 1) So will it be a hard or soft landing? We will touch on that in the labor market section.
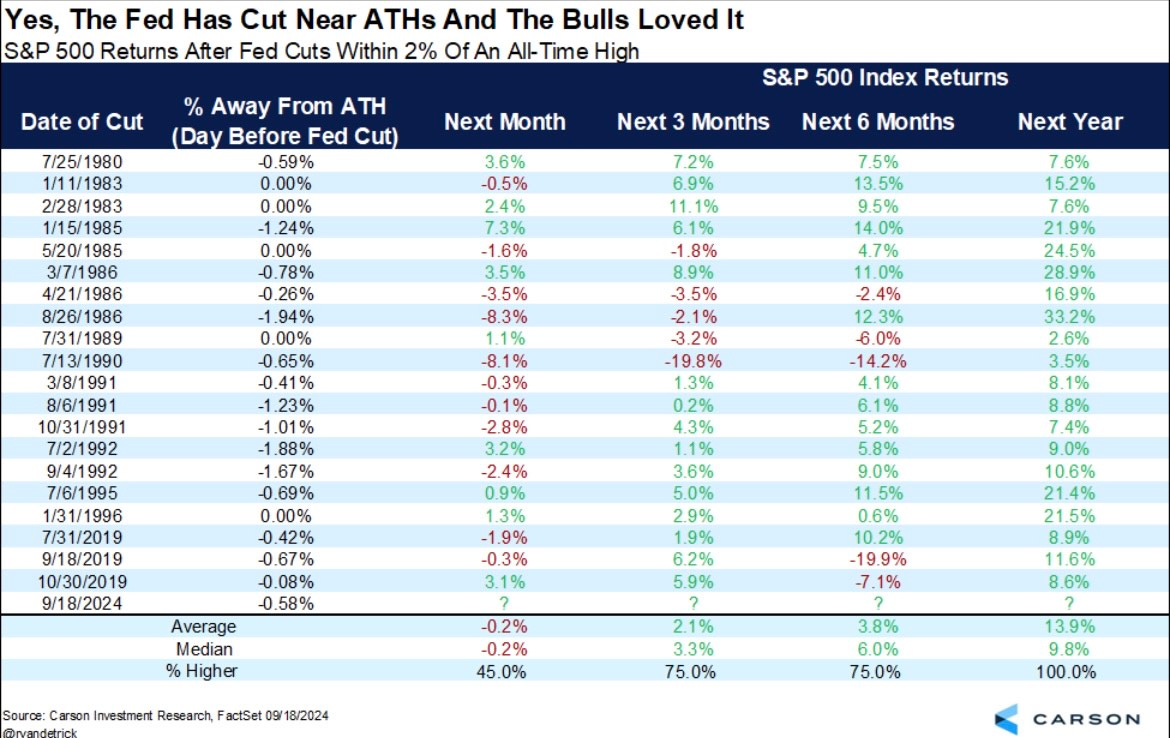
With that being said the next figure I have suggests that when markets are at or near all time highs the S&P 500 has performed well historically speaking, after a rate cut. (Figure 2) Carson Investment Research compiled the data and put it in this handy table which I have inserted below. (Figure 2) The following 3 months after a FED rate cut near all time highs resulted in an average return of 2.1% and a median return of 3.3% according to Carson Investment Research. (Figure 2) The next 6 months after a FED rate cut near all time highs has an even more impressive average return of 3.8% and a median return of 6.0%. (Figure 2)
So what can we make of this data? In my view nothing that happened in the past will happen again in the exact same way it played out before. However, I think this data can help us weed out some of the noise out there. In my opinion equites are likely to keep melting up for the rest of 2024. With two more FED meetings this year in November and December I think it is possible we see another 50-75 BPS of cuts.
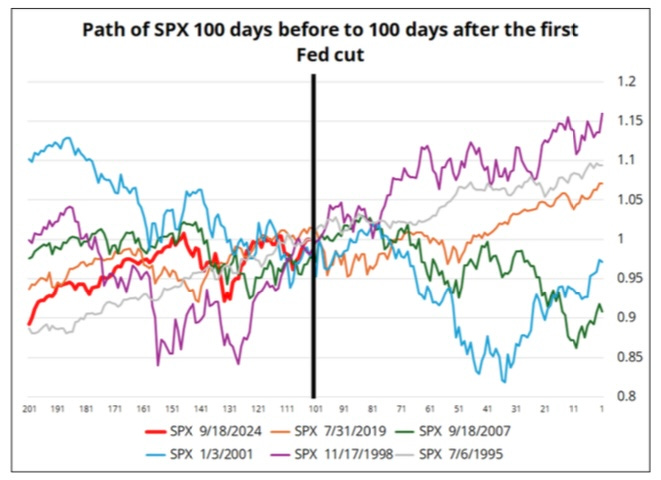
Now to look at some charts from Spectra Markets that show the returns of different assets 100 days before and after a FED rate cut. Lets start with the S&P 500 (SPX). This chart shows that most recent FED cuts see the S&P 500 average around a 1% gain in the 100 days following a rate cut. (Figure 3)
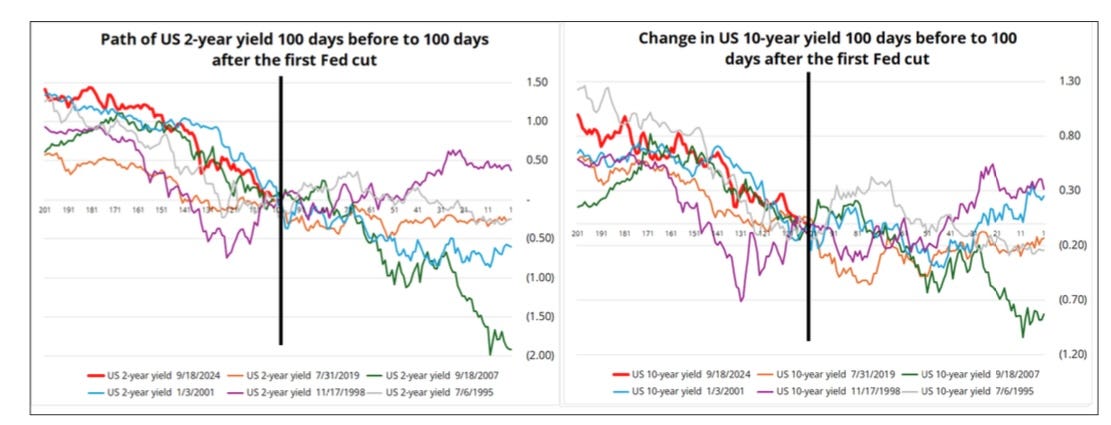
Next lets take a look at how US yields have reacted in the past to rate cuts. The 2-year yield dropped every time but once (in 1998) but the 10-year yield is more of a mixed bag. (Figure 4) With three negative return periods and two positive return periods. (Figure 4)
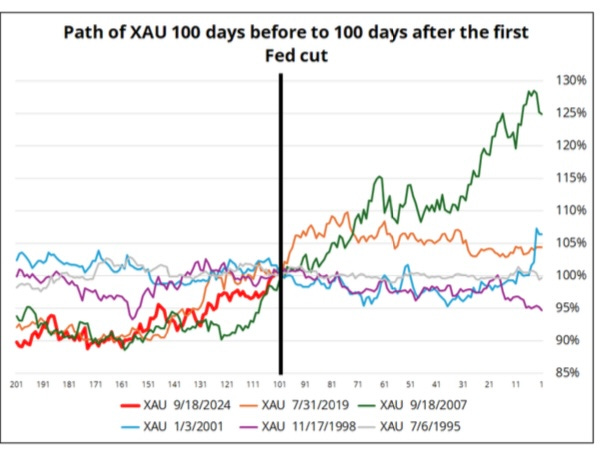
Next lets take a look at one of the most loved assets at the current moment, I am of course talking about gold. As you can see from Figure 5 rate cuts historically have been bullish for gold. With the best performance being in 2007 with a 25% gain in just 100 days after the FED cut rates. (Figure 5)
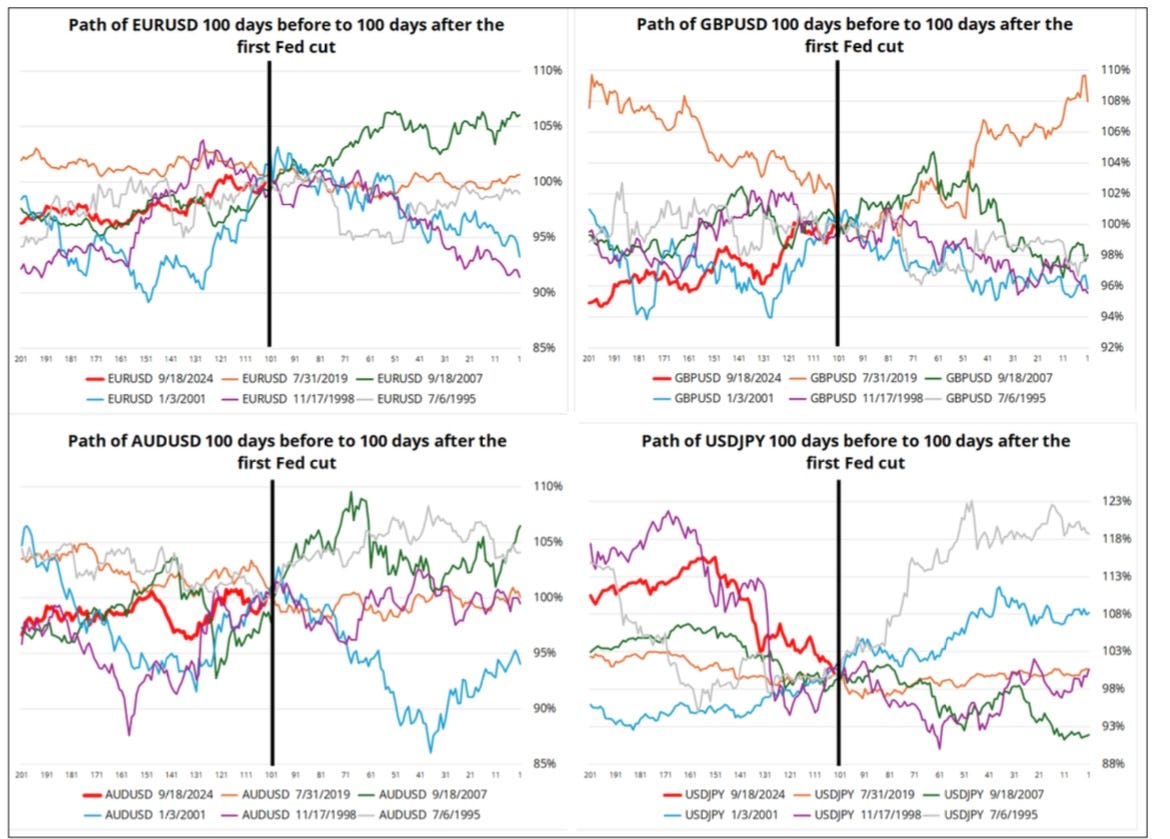
Finally we will take a quick look at how the US dollar has faired after FED rate cuts. (Figure 6) The four currencies that where compared to the US dollar, are the Euro, the British Pound, the Australian dollar and the Japanese Yen. As I do not really trade FX I don’t have much to add. Hopefully you get something from Figure 6, it’s better to have more data than less.
In conclusion I think that the most recent 50 BPS cut will be bullish for the US equity markets. Barring some kind of macro event that would throw a wrench in that.
US labor market overview-
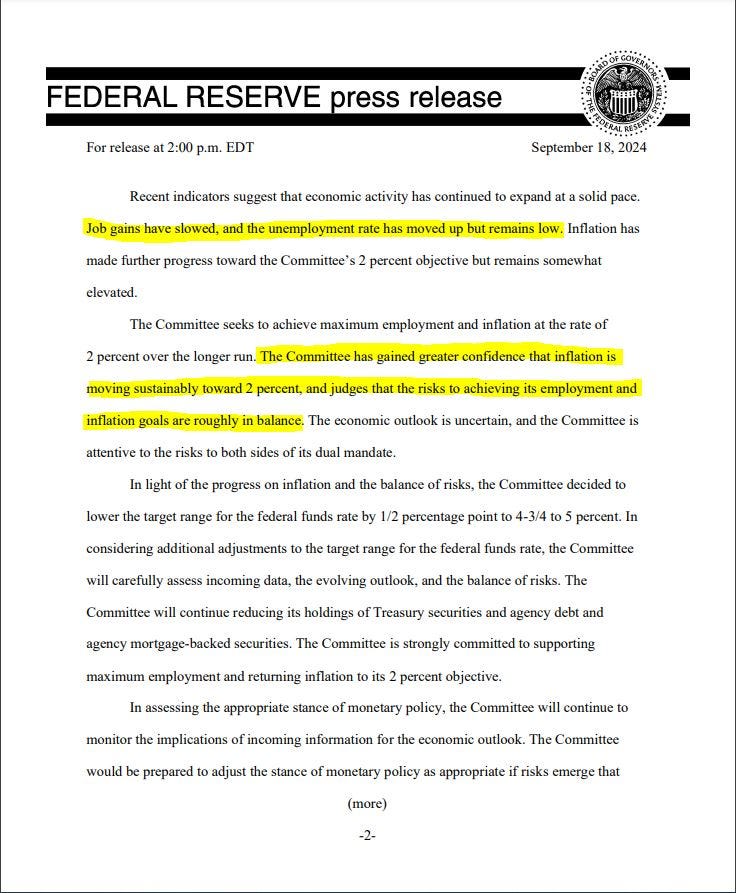
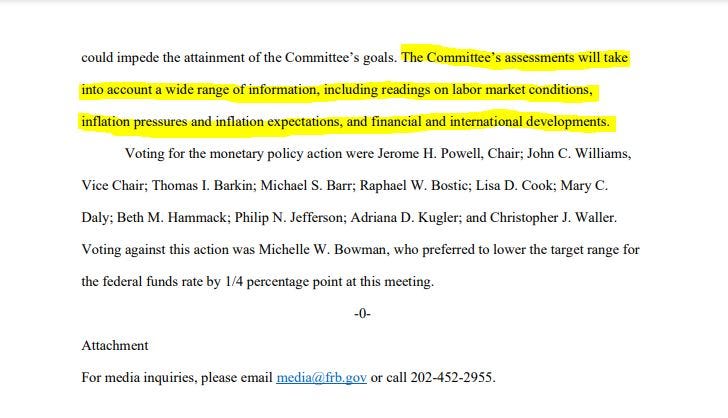
A key part of the macro story over this past year has been the strength of the US labor market. The labor market appears to be cooling off without a huge increase in unemployment which is part of the recipe for a soft landing. The FED even touched on this in their statement. I have highlighted the sections I think are important to the labor market story. (Figure 7 & 8)
Below is a labor market heatmap and the latest data is looking good. (Figure 9) However, it does appear that the labor market is cooling off for example broad unemployment is at its highest level since October of 2021. (Figure 10)
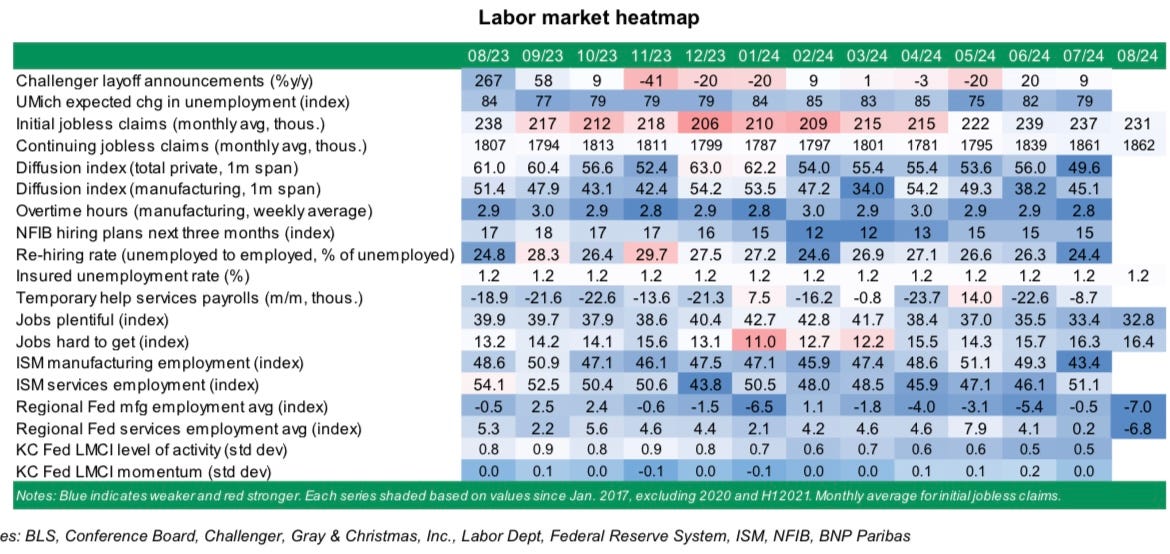

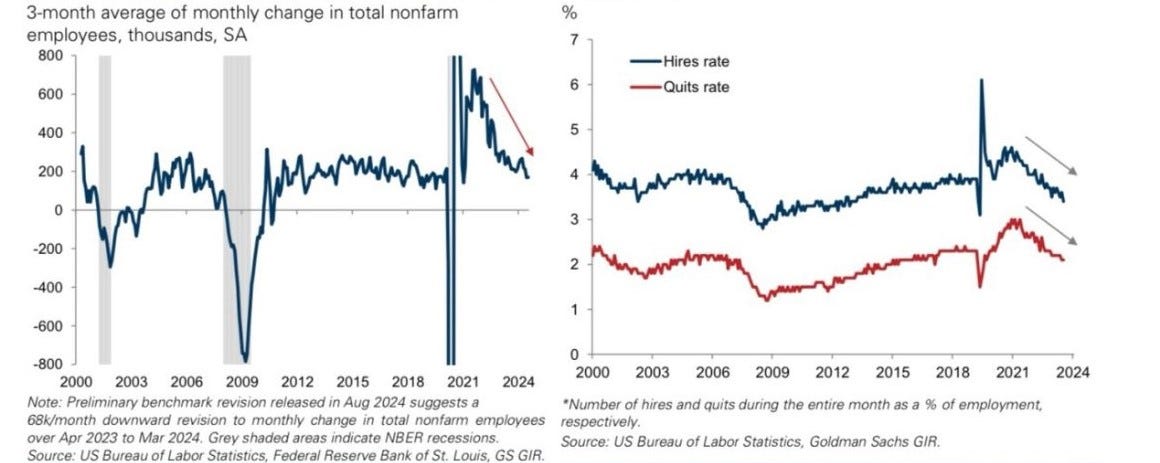
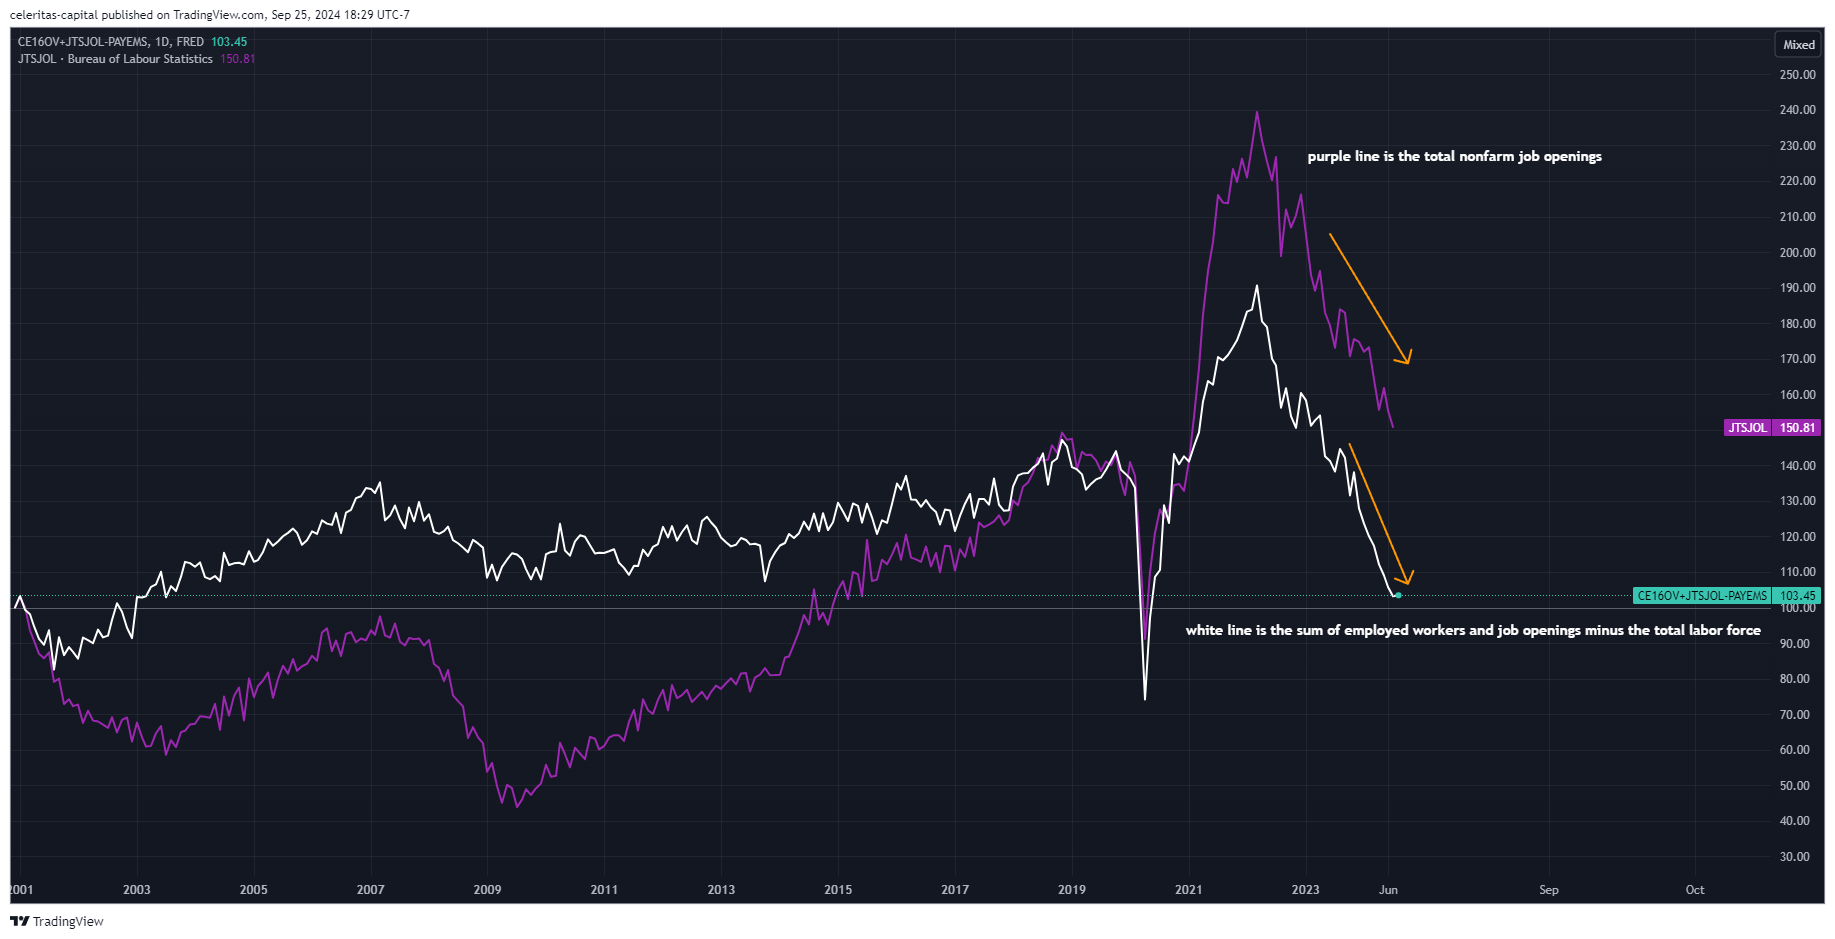
In recent months job growth has began to decline with the latest nonfarm print coming out to 142k jobs created. At the same time hires and quits have declined indicating a cooling labor market. (Figure 11) The labor market has started to rebalance to a point where further softening could hit jobs not just job openings. (Figure 12) That being said layoffs are still low historically speaking. (Figure 13) A soft landing appears to still be in the cards for the US.

US Presidential Election-
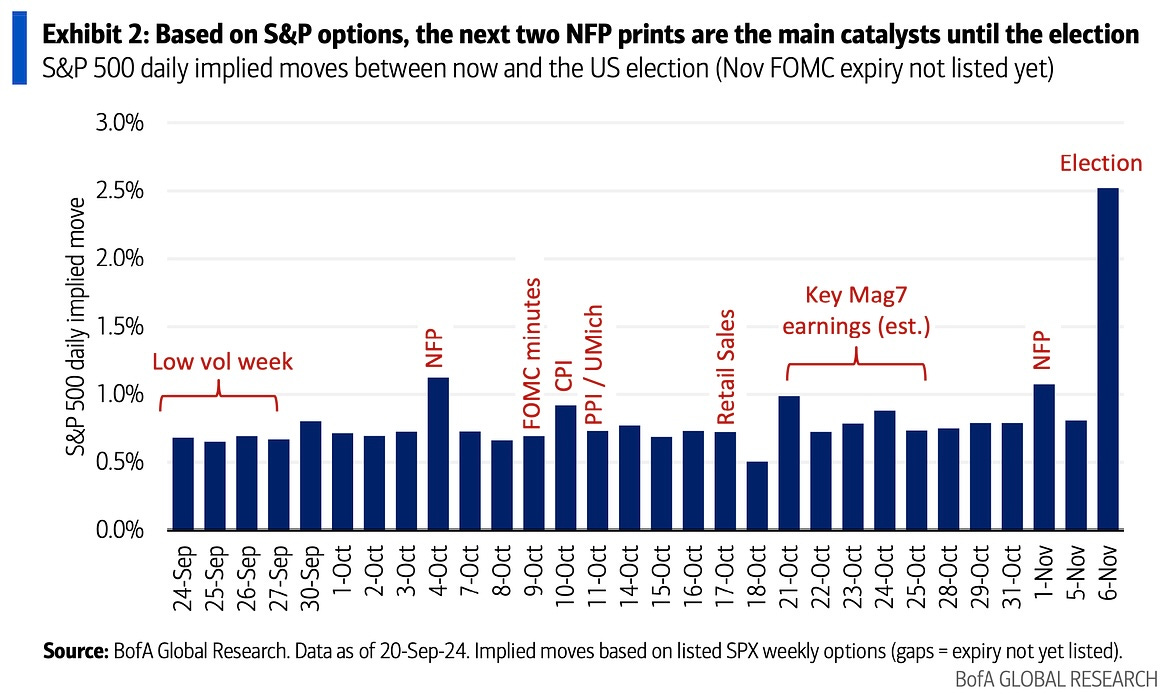
At the time of writing there are exactly 40 days until the next US Presidential election. How will markets react? I of course do not have a crystal ball and can’t tell the future. I can tell you that the option market is pricing in a pretty big move in the S&P 500 the day after the election. (Figure 14)
I also do not think it is controversial to say that the market will likely behave differently depending on who wins. Different industries will also benefit depending on which candidate wins, for example the fossil fuel industry will likely rally if Trump wins the election. If Harris wins I would not be surprised if the S&P 500 fell by a couple percentage points. I think a Trump win would result in a rather flat reaction from the S&P 500. The reason I believe a Harris win would result in the S&P 500 dropping by a couple percentage points due to the fact that Harris has stated she plans on raising the corporate tax rate to 28% from the current level of 21%. Trump on the other hand has said he plans on cutting the corporate tax rate to 15%. With that being said I do not foresee the election causing a market crash or anything like that, in-fact I think the market will have moved on from the election a few days after it happens. It is likely that the FED meeting in November will take the markets collective mind off the US Presidential election.
Now let’s quickly look at how both candidates might effect the overall economy. In the Trump scenario, short-term GDP is expected to receive a stronger boost, with growth projected to be 0.2% above the baseline due to considerable fiscal stimulus. (Figure 15) However, over the long term, more restrictive immigration policies may dampen growth, resulting in GDP that is 0.6% below the baseline over the next decade. (Figure 15) Additionally, inflation is expected to rise more sharply under Trump’s policies, driven by expansive fiscal measures and increased tariffs, with core PCE inflation potentially surpassing the baseline by over 0.3 percentage points annually. (Figure 15) (Note that the projections of GDP and core PCE are from research conducted by Oxford Economics.)
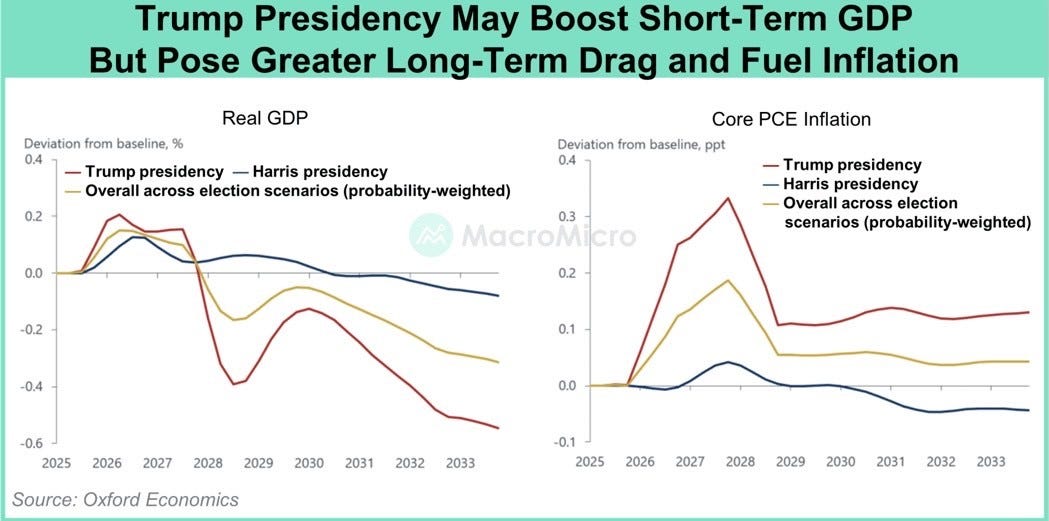
Conversely, under a Harris presidency, short-term GDP growth would also benefit from extended tax cuts, though long-term growth could be constrained by higher corporate taxes. However, both the short- and long-term GDP impacts are expected to be more modest compared to the Trump scenario. (Figure 15) Inflationary pressures under a Harris administration are projected to be minimal. (Figure 15)
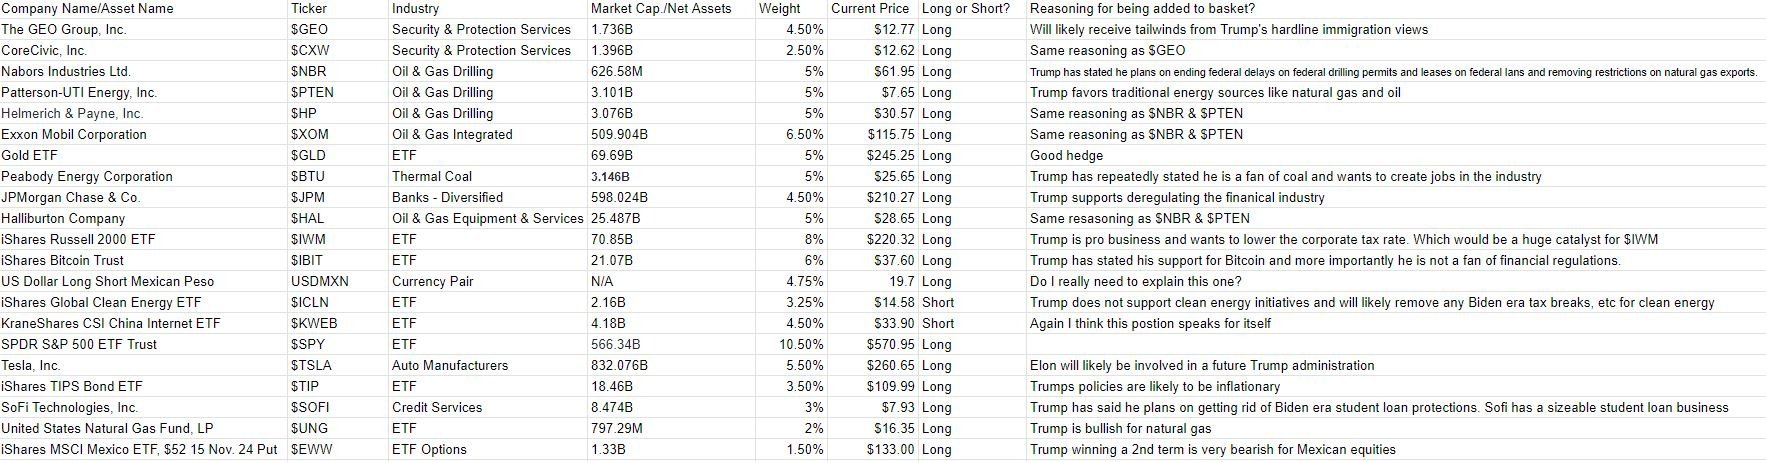
Finally, to wrap up this election talk I have prepared two baskets of assets. One basket assumes a Trump victory and is filled with assets I expect to outperform in a Trump Presidency. The second basket assumes a Harris victory and is filled with assets I expect to outperform in a Harris Presidency. Originally I planned on doing an article doing a deep dive into each basket, its assets and my reasoning behind each pick along with research. However, other things took priority but I thought I would still share the baskets.
The first asset basket we will cover is the Trump basket. The figure below shows my Trump asset basket. If you have any questions about my reasoning or anything please leave a comment below and I will respond.
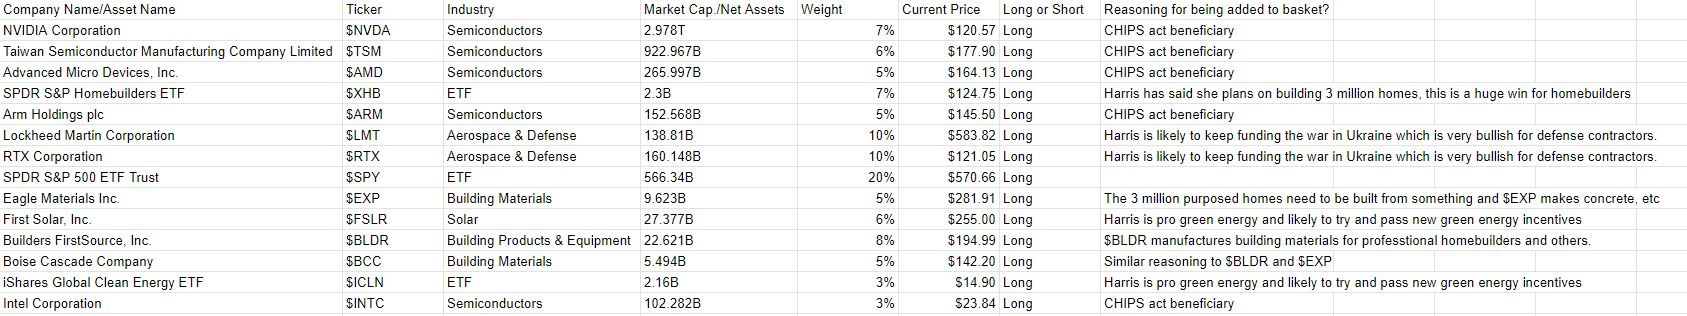
Now onto the Harris basket. I will admit creating the Harris basket was a lot harder for me. This is also my first time creating an asset basket like these so if you have any tips or suggestions please leave them in the comments or message me.
Trades-
To wrap up this article I’m going to be sharing some trade setups I am keeping an eye on.
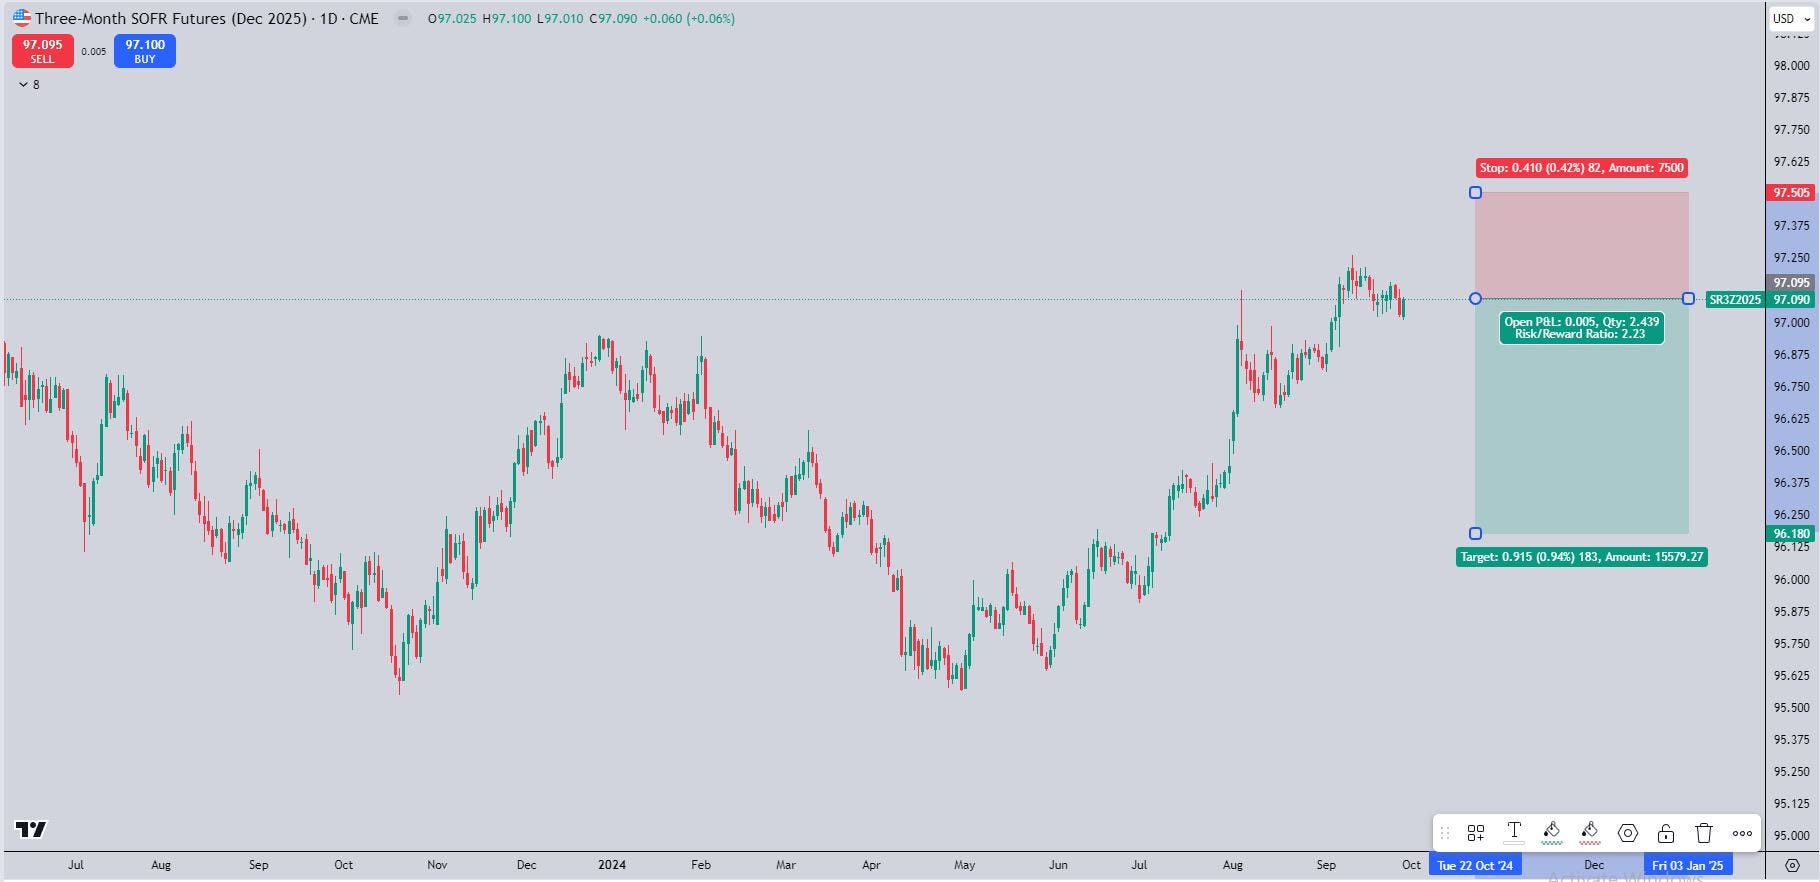
The first trade I am keeping an eye on is shorting SR3Z2025 futures. Figure 16 shows the R:R I am aiming for. My reasoning for this trade is that I believe the SOFR contract has too many rate cuts priced in.
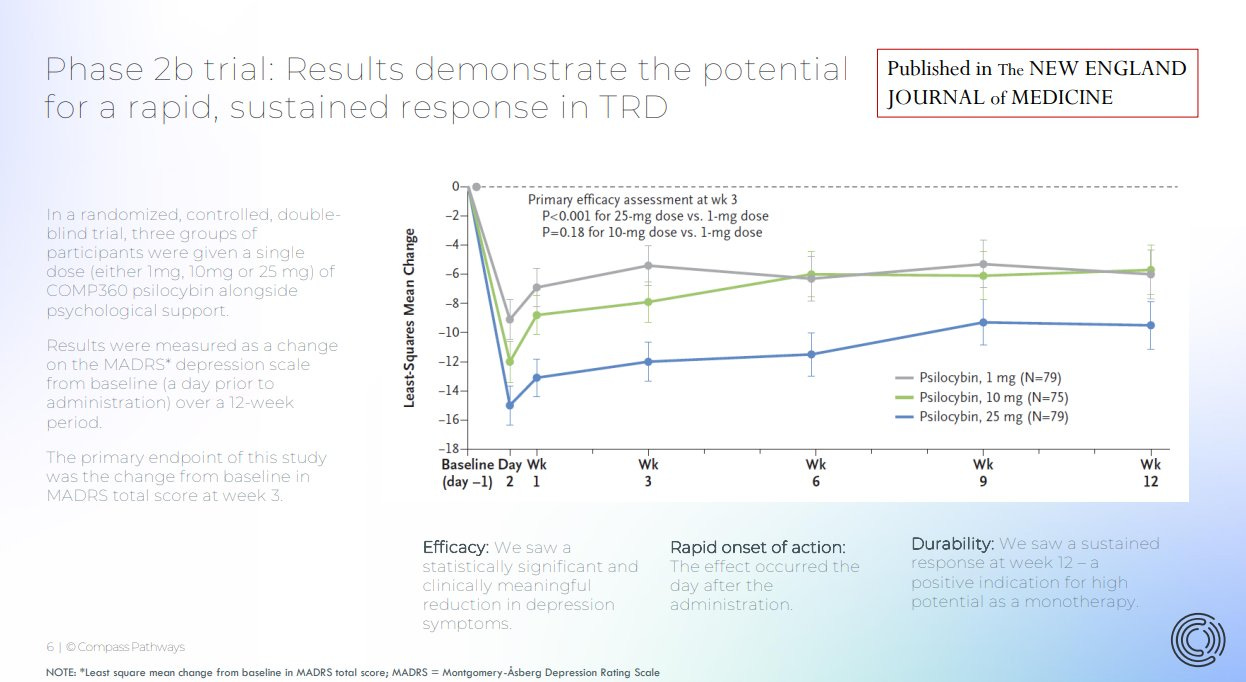
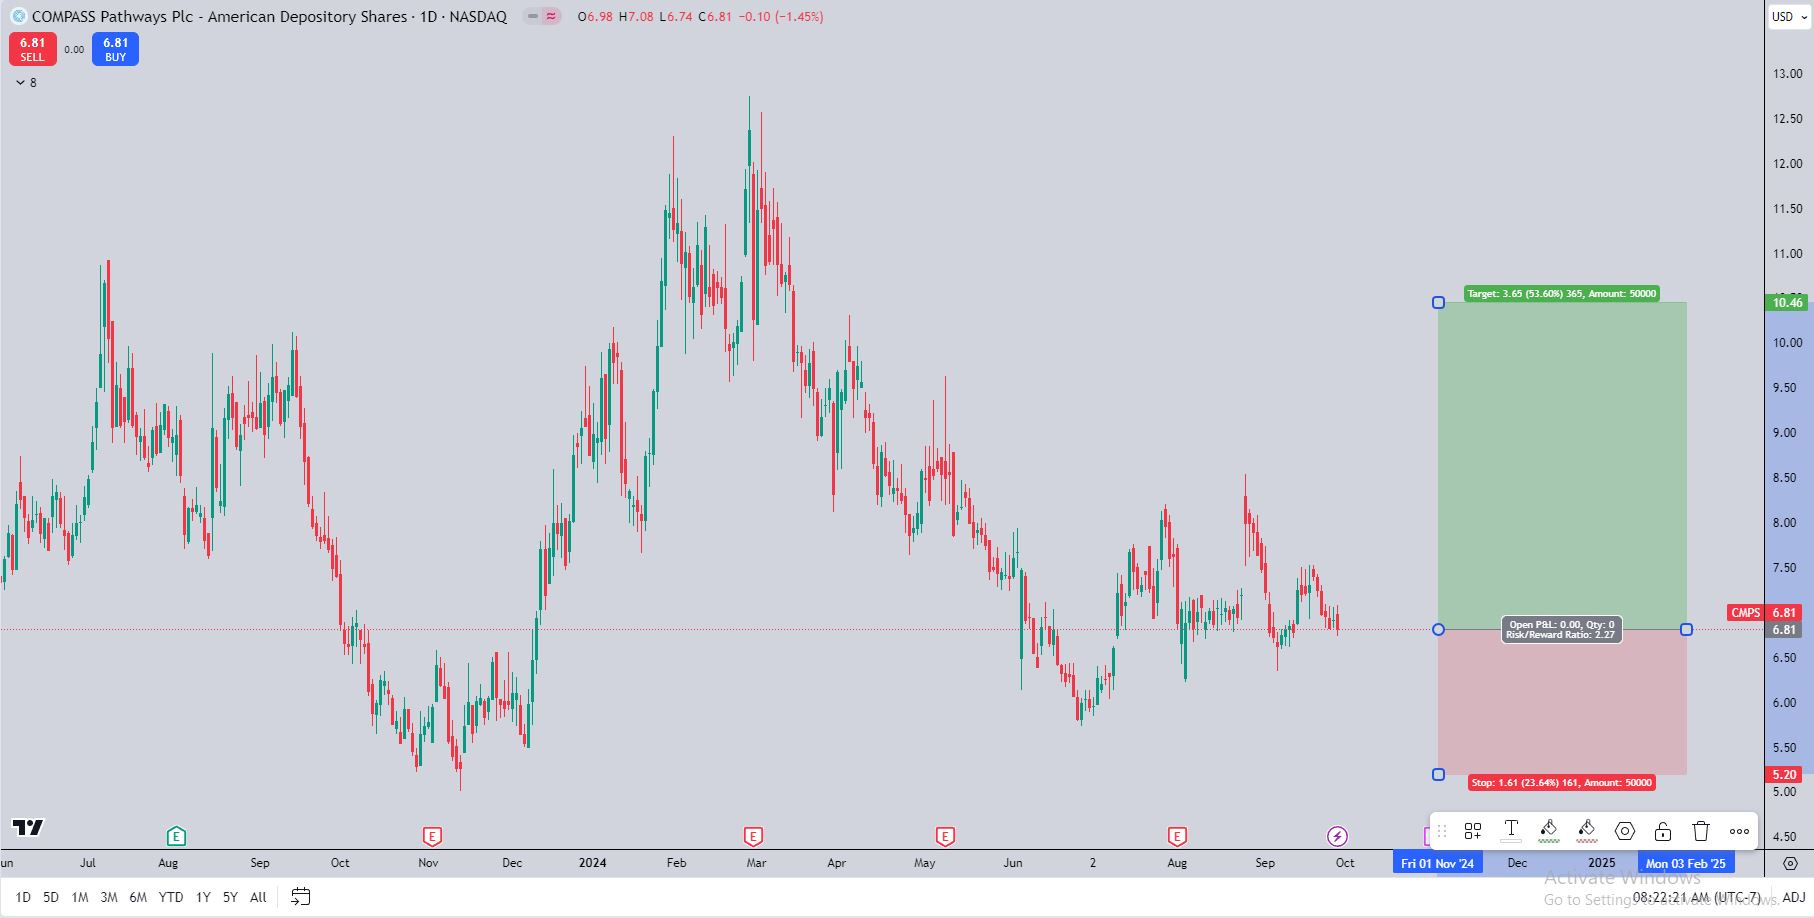
Next trade is one that long time readers won’t be surprised by, it is a biotech catalyst trade. The company is CMPS 0.00%↑ (Compass Pathways PLC) they are a clinical biotech company focused on mental health treatments. The catalyst in question is a Phase 3 study, results are expected before the end of this year. What is the treatment? Psilocybin, aka magic mushrooms. What can magic mushrooms possible treat I hear some of you say. Well Compass Pathways is creating a psilocybin medication for Treatment-Resistant Depression. I won’t get into in this article but many psychedelic drugs along with substances like MDMA and ketamine have shown great success in treating mental health issues like PTSD, anxiety and depression. If you’re interested in a deeper dive into the different biotech companies that are currently testing psychedelic treatments and the efficacy of these treatments please let me know in the comments or via private message. It is a field of study I am extremely interested in. Now back to CMPS 0.00%↑ if you haven’t read my past articles on biotech I will quickly explain the most common ways to trade a biotech catalyst. The first and simplest is the classic buy and hold. In this strategy you identify a biotech company with a catalyst in the next several months like CMPS 0.00%↑ for example and you buy shares and hold through the catalyst. This is rather risky as biotech catalyst can be extremely volatile, especially for companies in the clinical stage. The other common way to trade biotech catalysts is similar to the buy and hold strategy, but instead of just holding you sell shares before the catalyst to limit your downside. I should also mention it is likely that the shares of the biotech company with an upcoming catalyst are likely to increase in price as the catalyst date approaches. Below I have included a summary of the results from the previous phase of the CMPS 0.00%↑ psilocybin study. (Figure 19)
That was a rather long winded explanation for my trade idea but I felt it was necessary background information.
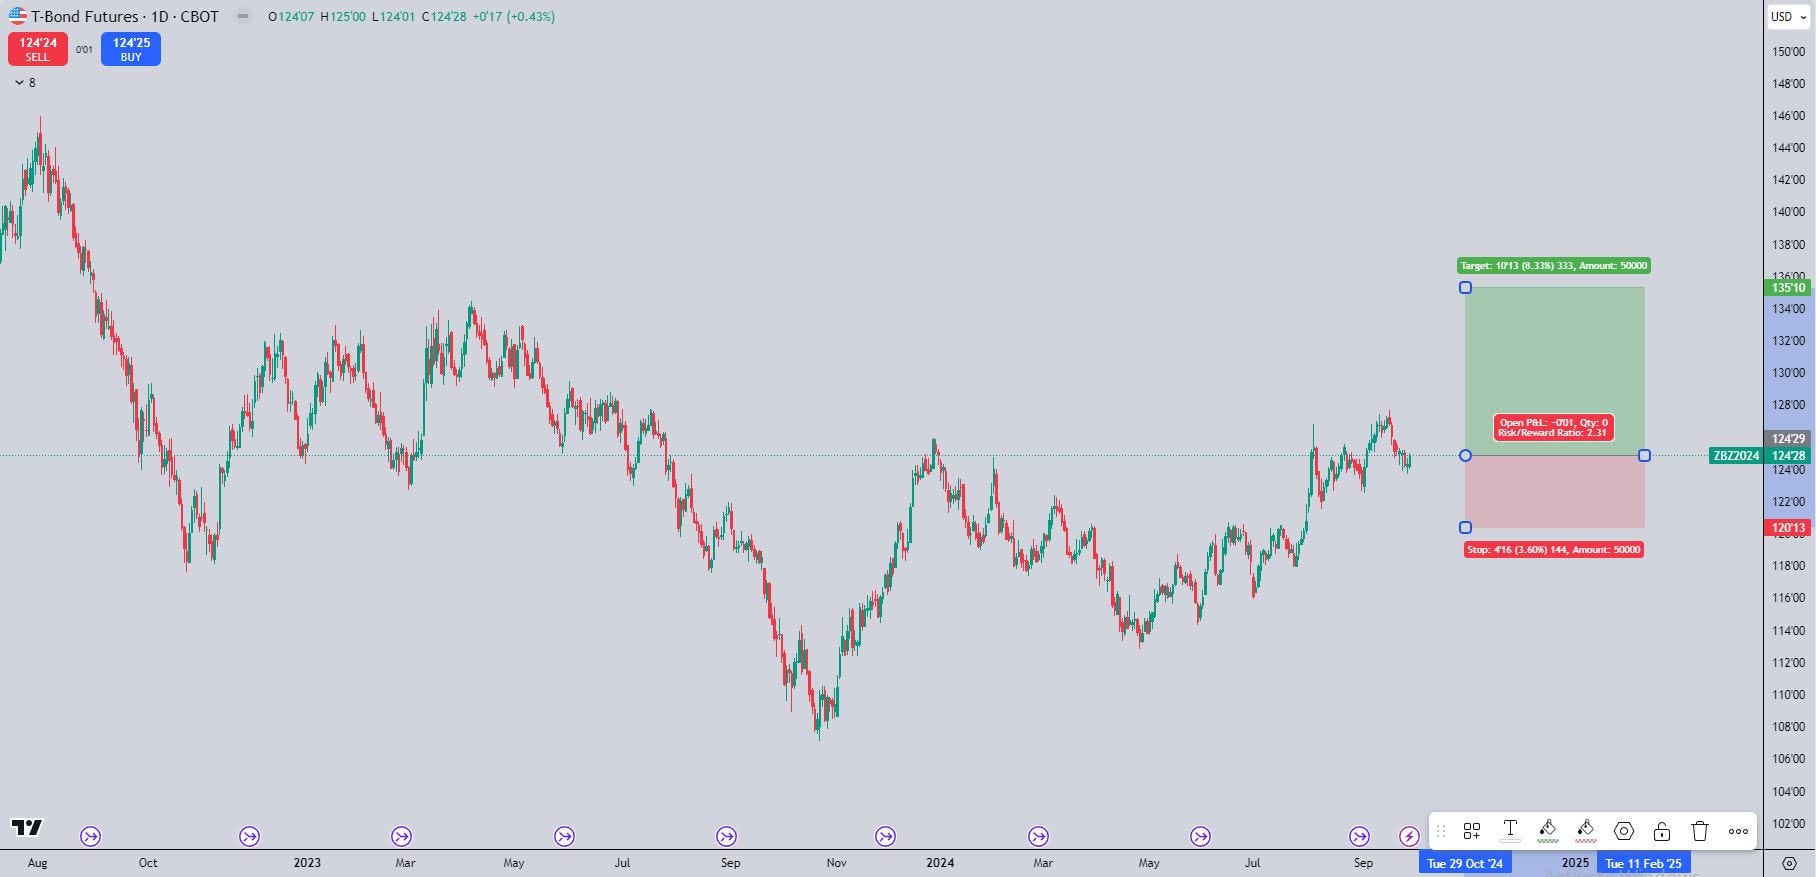
The next trade I am watching is the US 30 year bond future contract. I am bullish bonds due current cutting cycle by the Federal Reserve. Below is the R:R I am aiming for. (Figure 21)
Conclusion-
Thank you for reading this article. I am extremely grateful that I am able to share my thoughts on markets with all 260 of you! Hopefully you found something in this article that was useful or insightful if you did please consider sharing Celeritas Capital with others.
I plan on posting more content through out the rest of the year and into 2025. If there’s any type of articles you would like to read please leave any suggestions in the comments below. I am mainly going to be focusing on writing primers similar to my corporate bond primer (part 2 coming soon!) along with equity deep dives. Thank you again for the support and as always please feel free to leave a comment or send me a direct message.
DISCLAIMER: We are not Financial Advisors, and all information presented is for educational purposes ONLY. Financial markets can be highly volatile, so good risk management is a must.
Typically, stocks go up after an election no matter who wins, it's one of the most consistent trades there is.